Basic QC Practices
2025 Great Global QC Survey: Chemistry and Hematology
In 2025, the Westgard Great Global Survey assessed the state of QC practices. Why are the QC experiences so different between chemistry and hematology?
The 2025 Global QC Survey Results: Chemistry and Hematology differences
Sten Westgard, MS
December 2025

[This survey was completed with the support and partnership of Thermo Fisher MAS controls.]
In 2025, have QC practices around the world improved or declined?
We surveyed laboratories in 2017 and 2021 about their quality control practices. We did it again in 2025.
We got over 1,280 complete, qualified responses, which break down as follows:
- Africa 118 responses
- Asia 289 responses (note that we include everywhere from India to Australia within this group)
- Europe 143 responses
- Latin and South America 114 responses
- Middle-east 146 responses
- United States and Puerto Rico 440 responses
Asia: 2025 Great Global QC Survey Results: Asia Breakout - Westgard QC
Europe: The 2025 Great Global QC Survey: Europe in isolation - Westgard QC
Middle-East: 2025 Great Global QC Survey Results: Middle East - Westgard QC
Latin and South America: 2025 Great Global QC Survey Results: South and Latin America - Westgard QC
Africa: 2025 Great Global QC Survey Results: Africa - Westgard QC
USA: https://westgard.com/qc-applications/basic-qc-practices/2025-qc-survey-usa.html
All of it together: https://westgard.com/qc-applications/basic-qc-practices/2025-global-qc-survey.html
While we've completed regional analyses, we decided to look deeper at the differences between different sections of the laboratory.
- chemistry sections 894 responses
- hematology sections 136 responses
Please note, you can click on these graphs and expand them to a larger size. Here they are shrunk down to help make the comparisons easier to visualize.
The QC Set Up
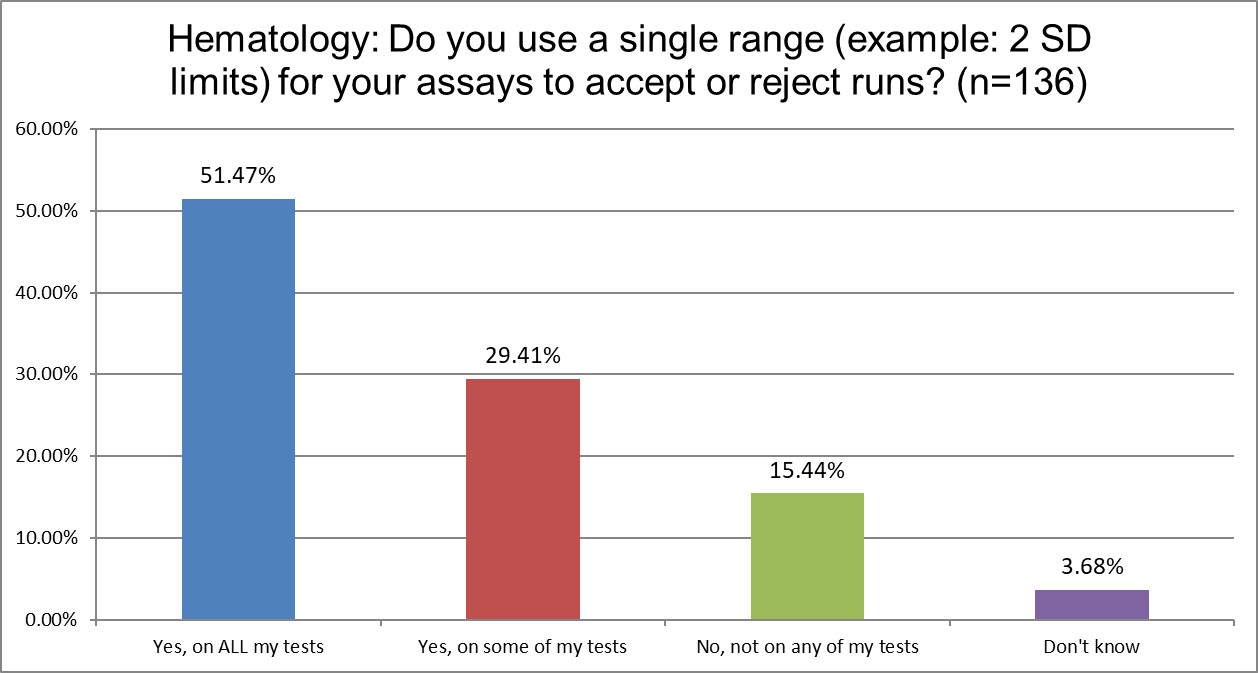
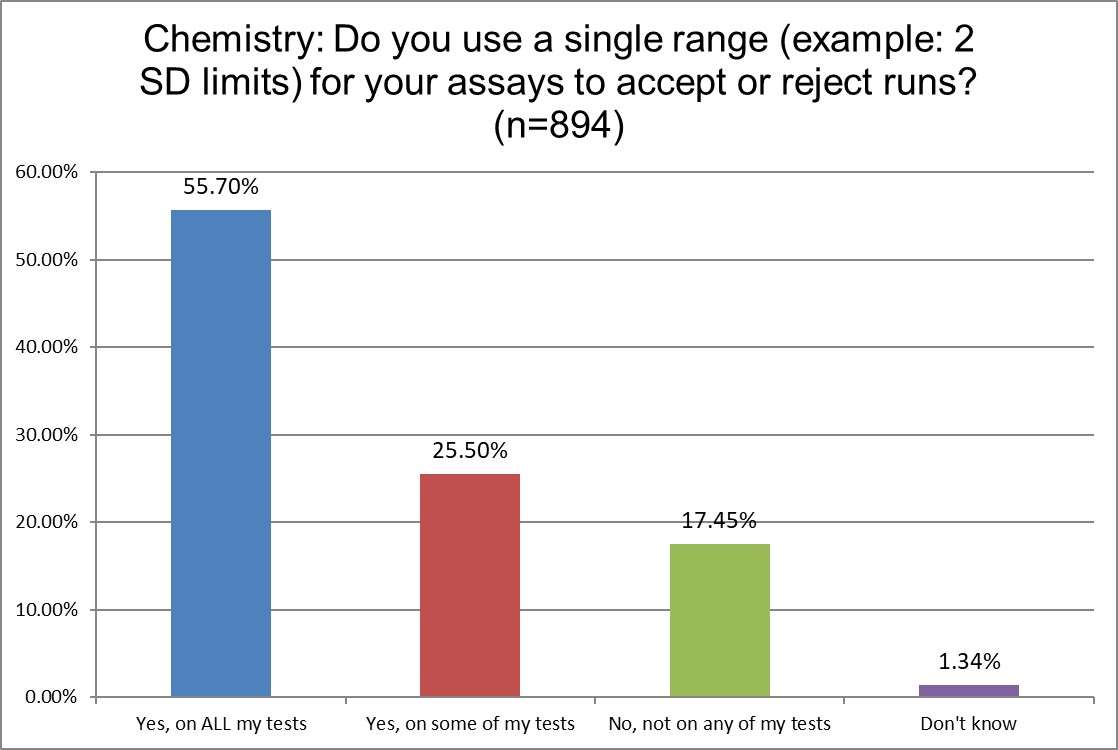
The use of 2 SD in hematology and chemistry is quite similar. A slight majority of both sections in both groups use 2 SD on everything. About a qurter of each group uses 2 sd on some tests. And even the percentage of sections not using 2 SD is almost the same.
Warning, Rejection, or Both?
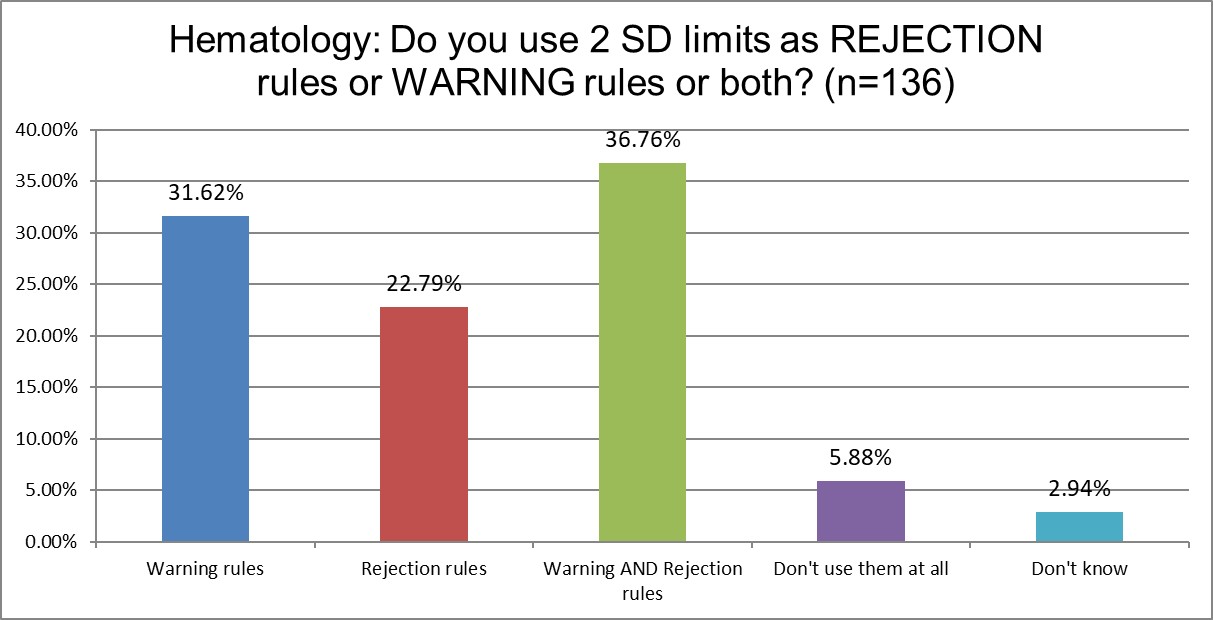
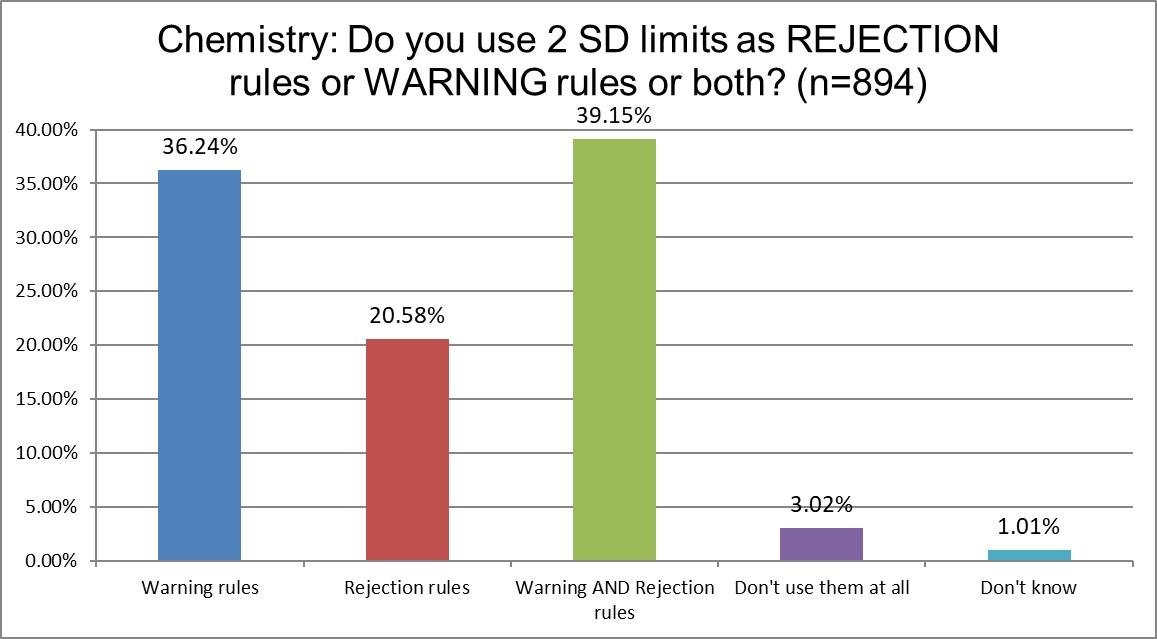
The similarities continue. About a third of each section uses the 1:2s as a warning rule. About a fifth uses them only for rejection rules. And a little over a third use them for both. The point here is that the majority of both sections are using the 1:2s as something other than a mere warning rule. This is not what is recommended for modern labs.
Are mean and SD choices influenced by accreditation type?
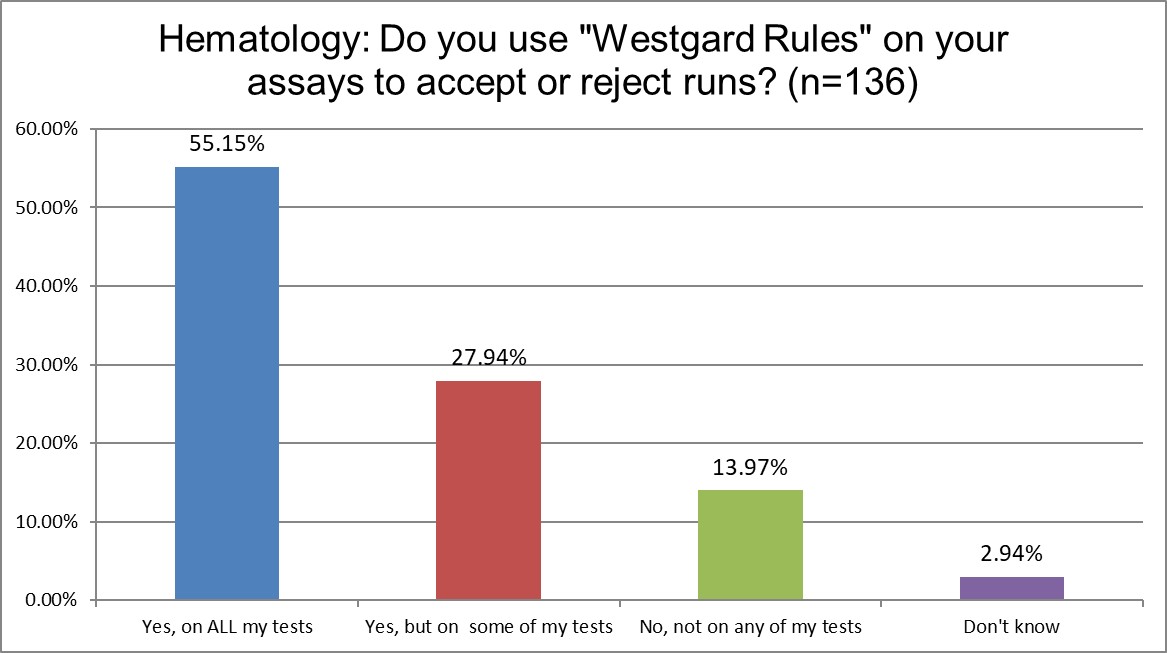
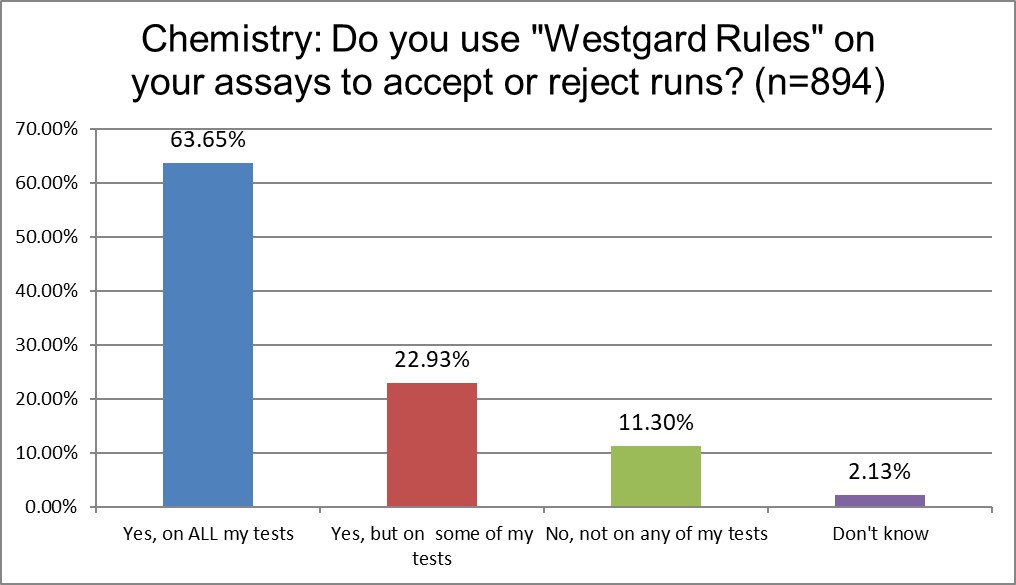
Here we start to see some difference between the two groups. Chemistry is more likely to use "Westgard Rules" on all tests than hematology. Overall, over 80% of both sections use "Westgard Rules" in some part of th laboratory.
Are mean and SD choices influenced by accreditation type?
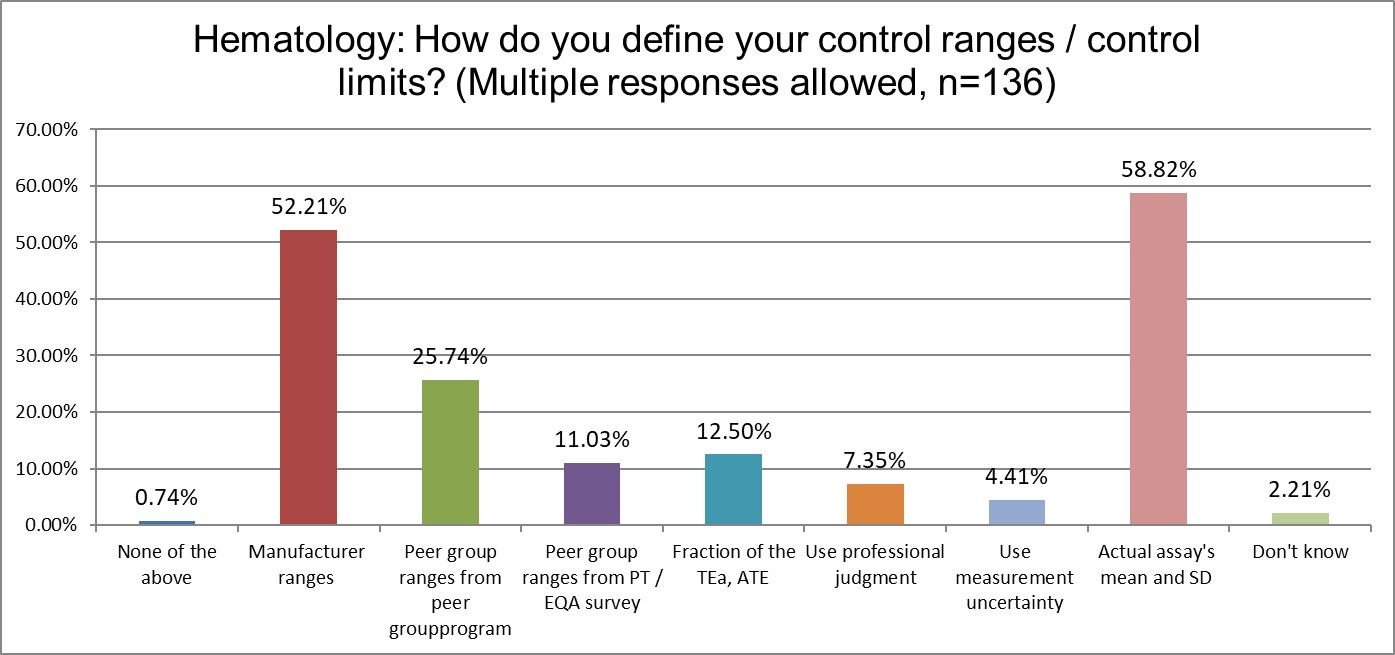
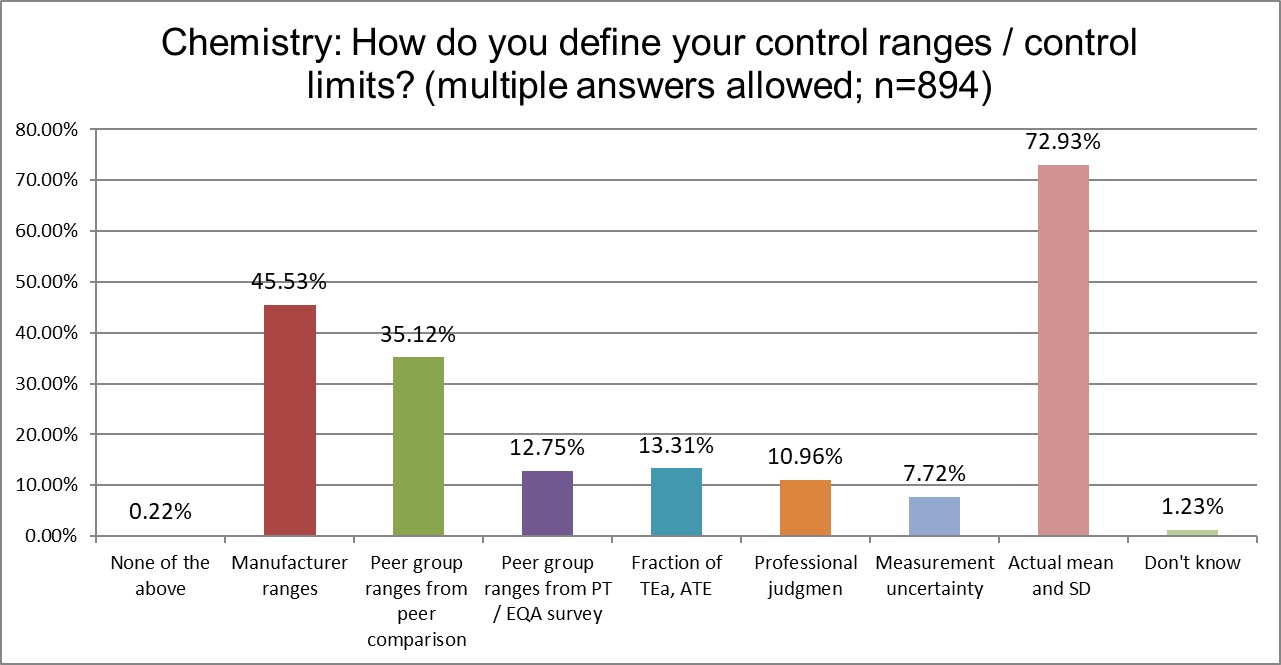
Here we start to see significant differences between the two groups. Hematology makes more use of manufacturer ranges for QC, while chemistry makes significantly more use of their actual mean and SD.
What kind of controls are being used in hematology and chemistry sections?
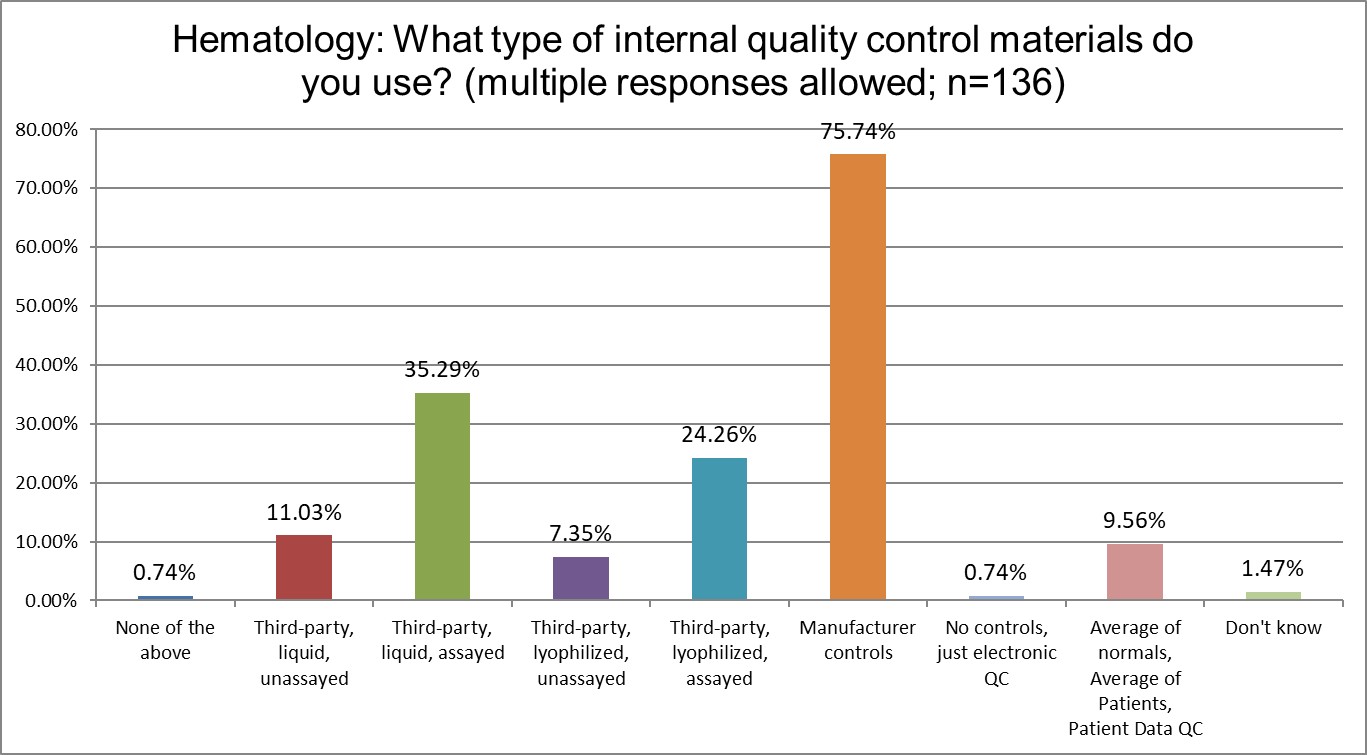
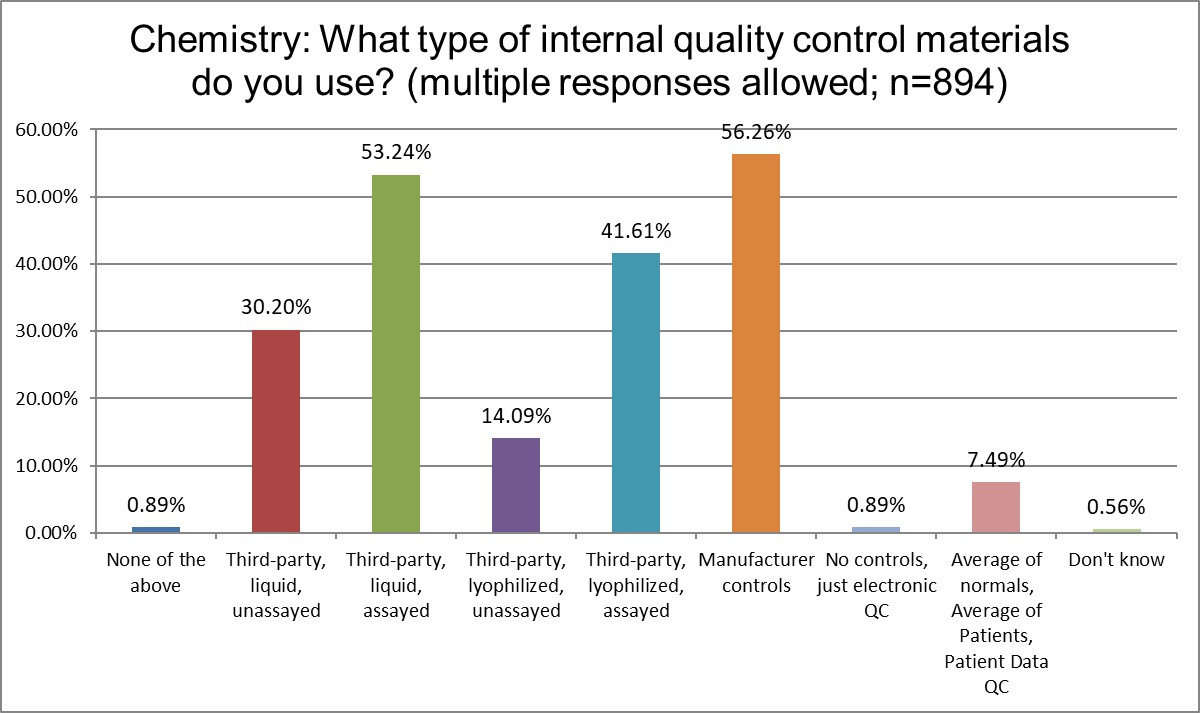
Using manufacturer controls is extremely common for hematology sections, almost 20% more than in chemistry sections. Chemistry sections make far more use of 3rd party controls, with liquid controls more popular than lyophliized controls.
Just how much QC is patient-based?
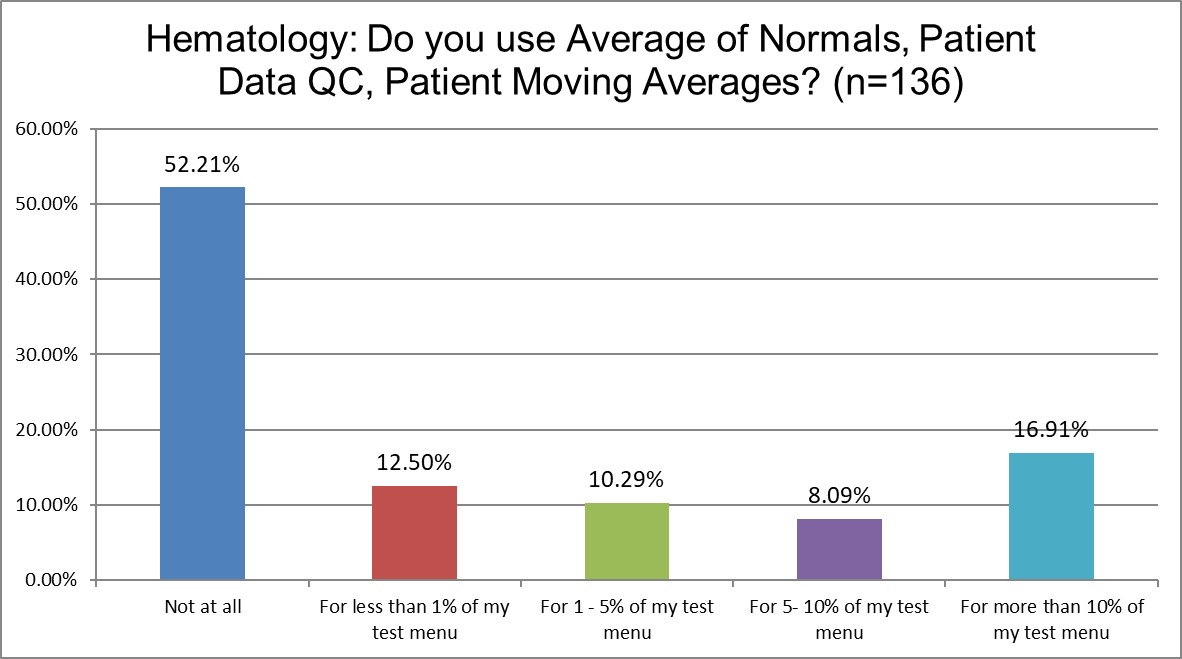
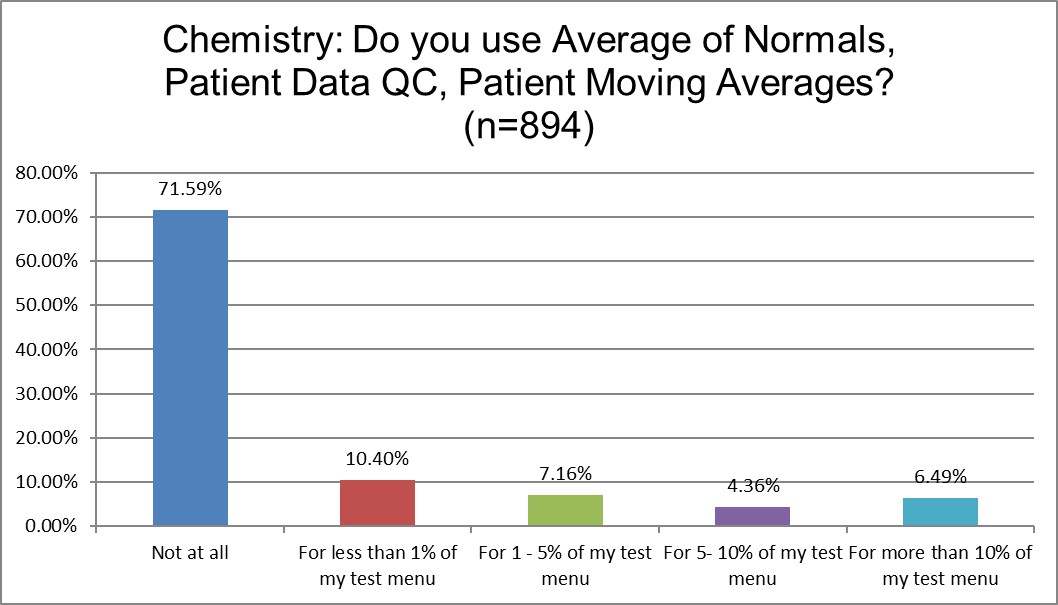
Chemistry sections are significantly more likely to make no use of patient data QC techniques (71.59% vs 52.21%). And hematology sections are more than twice (16.91% vs. 6.49%) as likely to use it for a significant part of their test menu. The history of the use of Bull's algorithm makes it more common to use this approach in hematology.
The Frequency of Running Controls
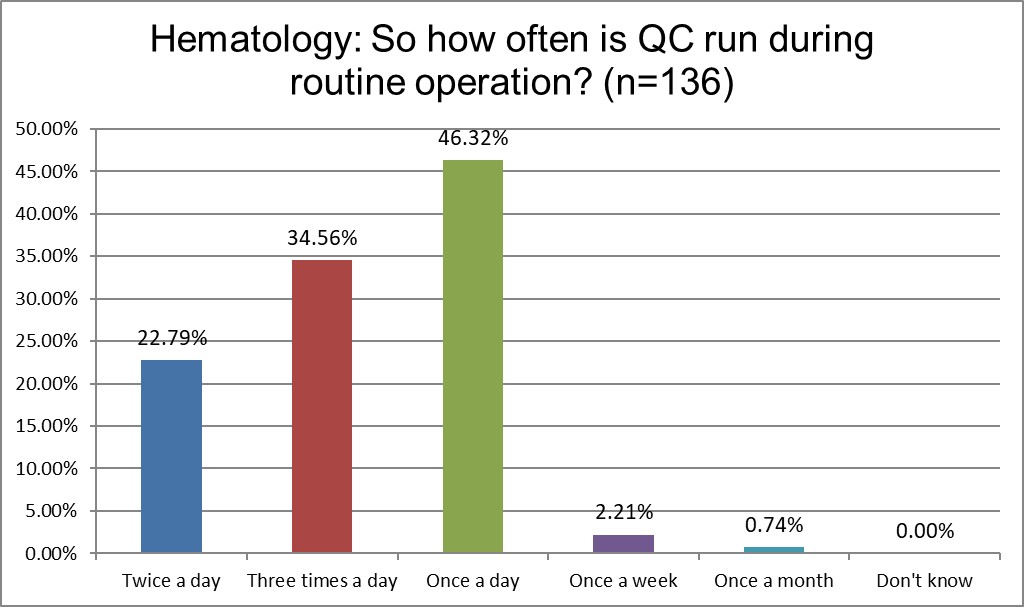
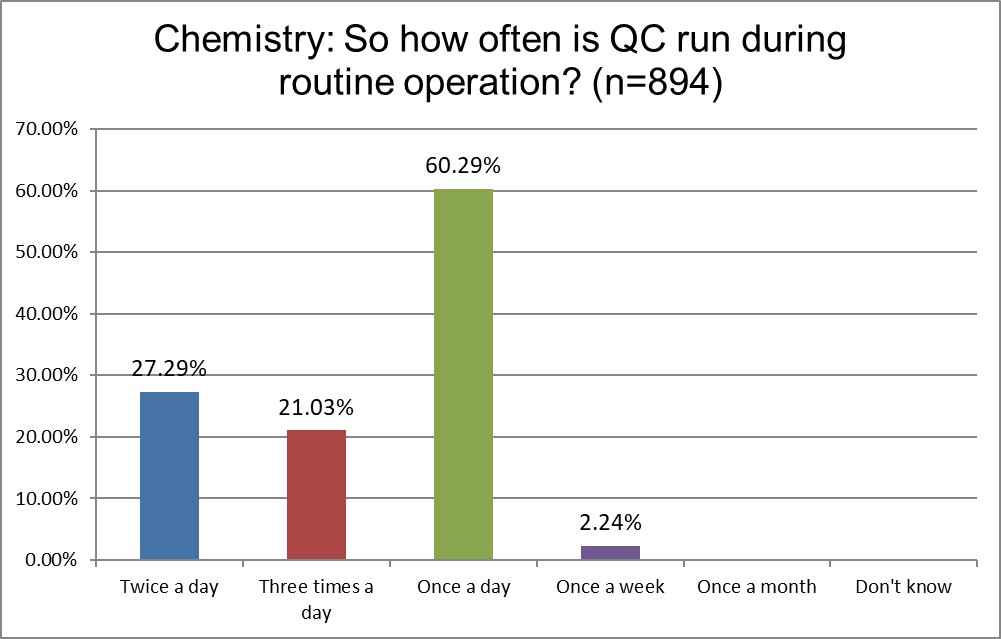
Hematology sections are far more likely to run QC three times a day than chemistry sections (34.56% vs. 21.03%). Far more likely for chemistry sections to run QC once a day (60.29% vs 46.32%). If hematology sections are running 3x the QC everyday, doesn't that triple the danger of false rejections and out-of-control events?
Who has more trouble when troubleshooting? Chemistry or hematology?
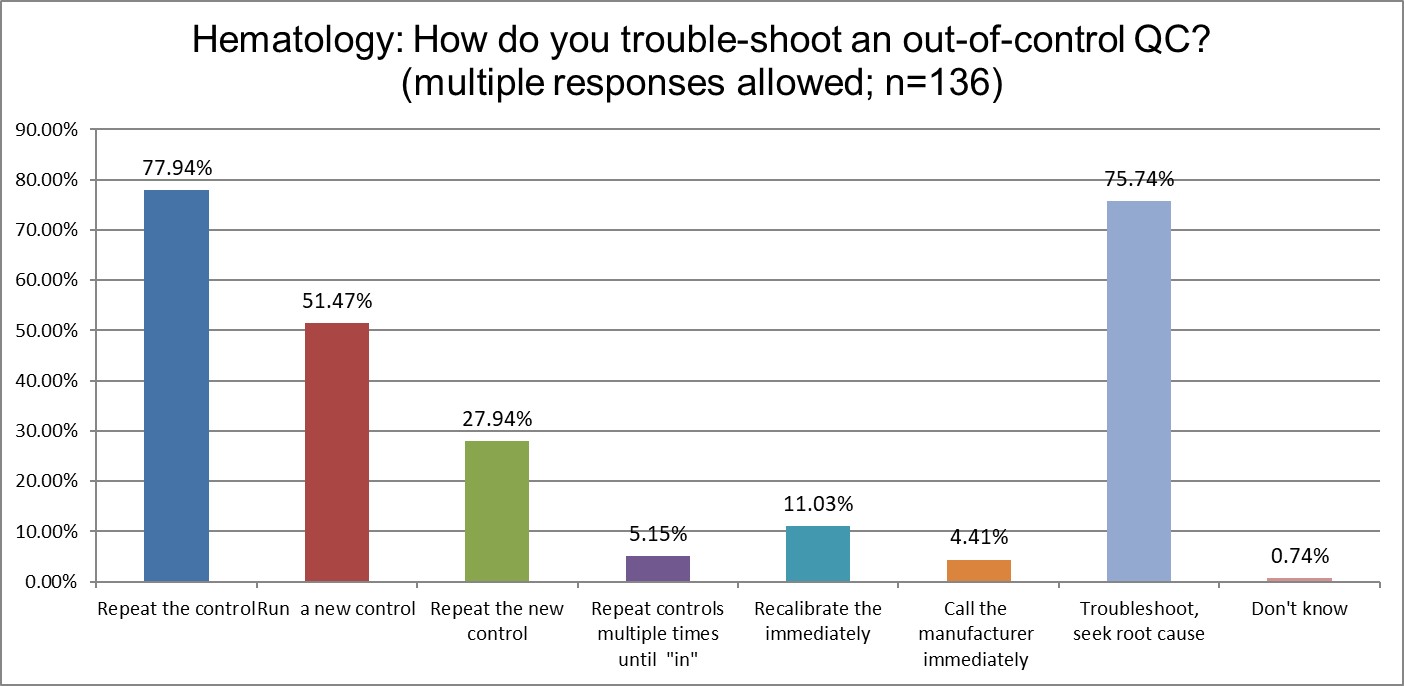
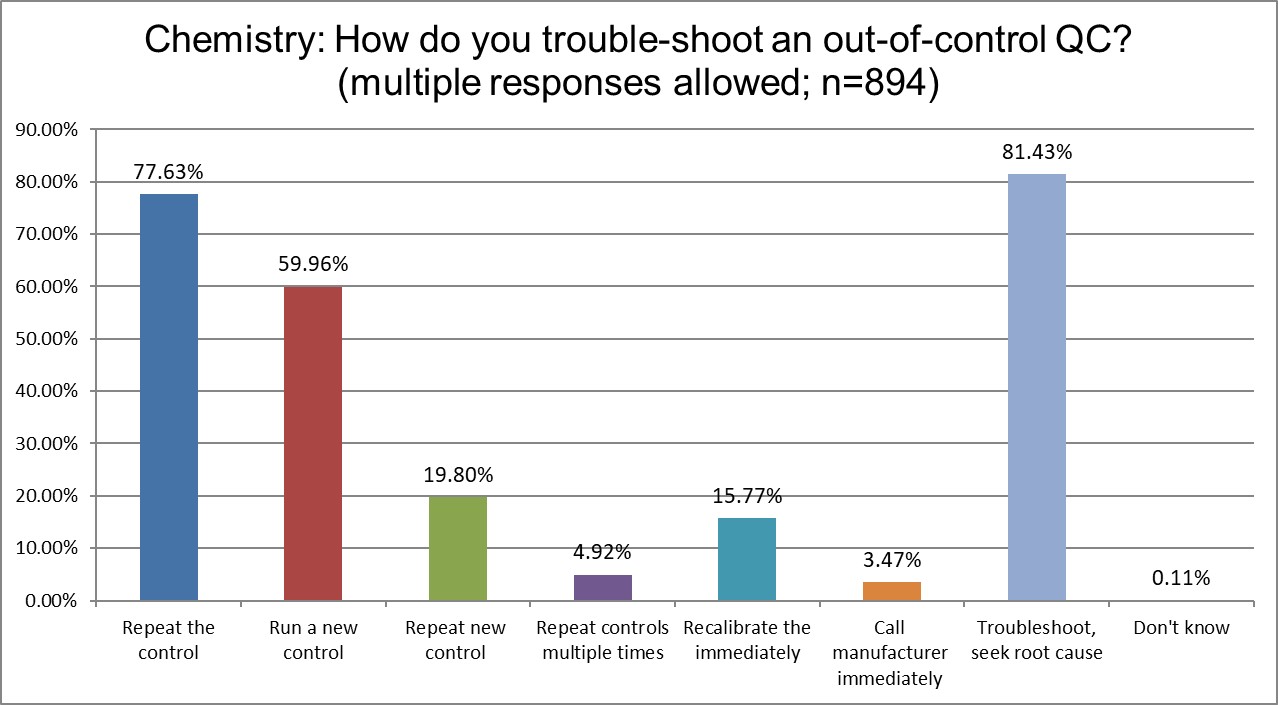
Both lab sections are equally likely to repeat a control after an outlier. Chemistry is more likely to run a new control after that (59.96% vs. 51.47%). Hematology is more likely to run a new control (27.94% vs. 19.8%).
Who's out of control more often? Chemistry or hematology?
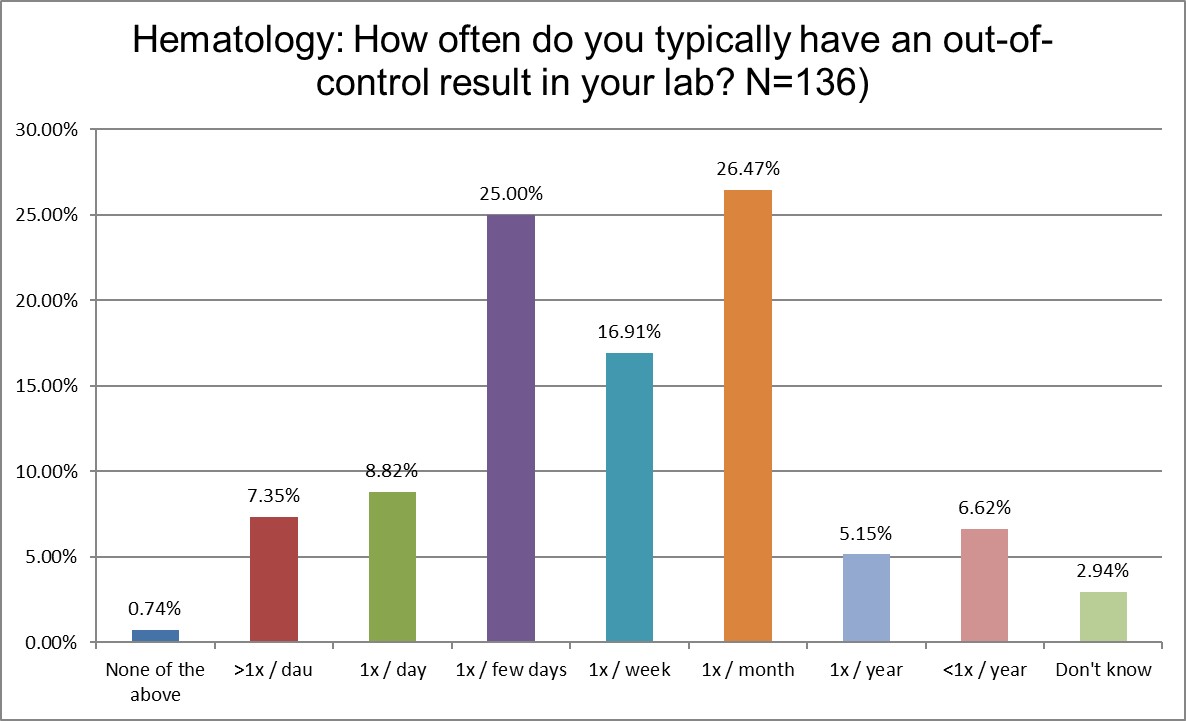
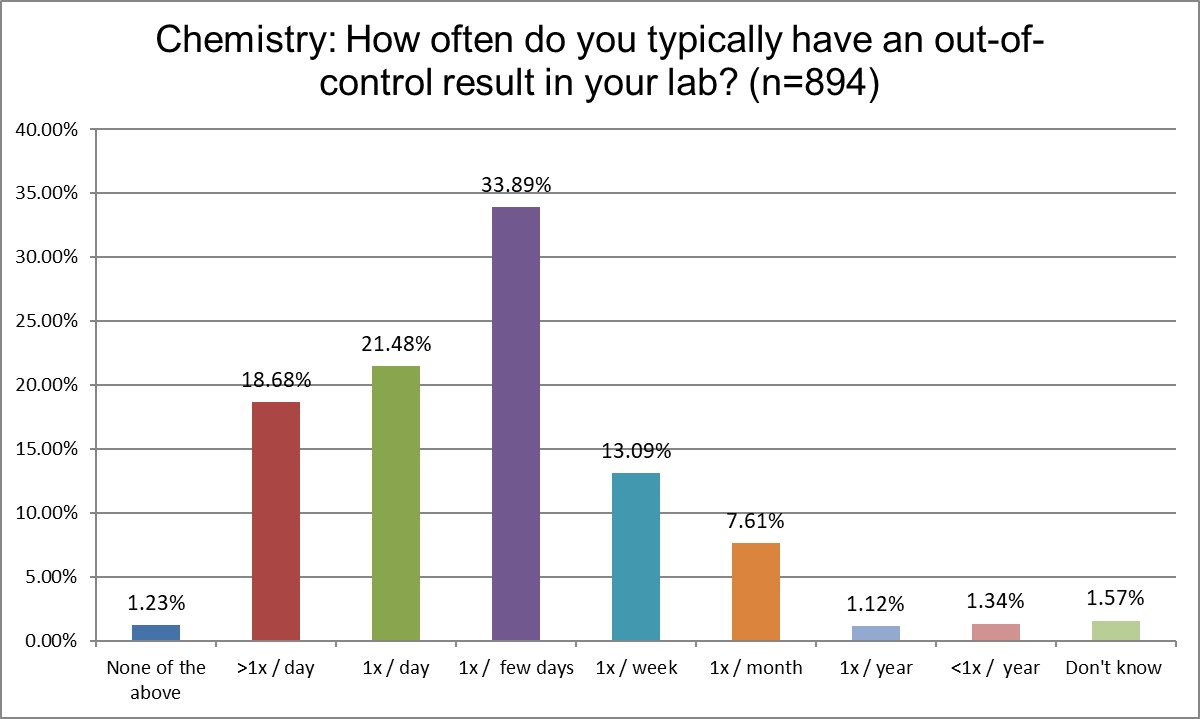
Here is perhaps the most significant different yet. Over 40% of chemistry labs report being out of control every day, if not multiple times per day. In hematology, that propotion is only just over 16%. Chemistry sections are more than twice as likely to be out of control every day than hematology sections. Further, over a quarter of hematology sections are out of control only once a month. For chemistry sections, that number is 7.61%. Hematology sections are almost 3.5 times more likely to have just one out of control even in a given month. What's going on? Are hematology instruments so much better engineered? Are chemistry sections significantly more error prone?
How likely are chemistry and hematology sections to override their own QC?
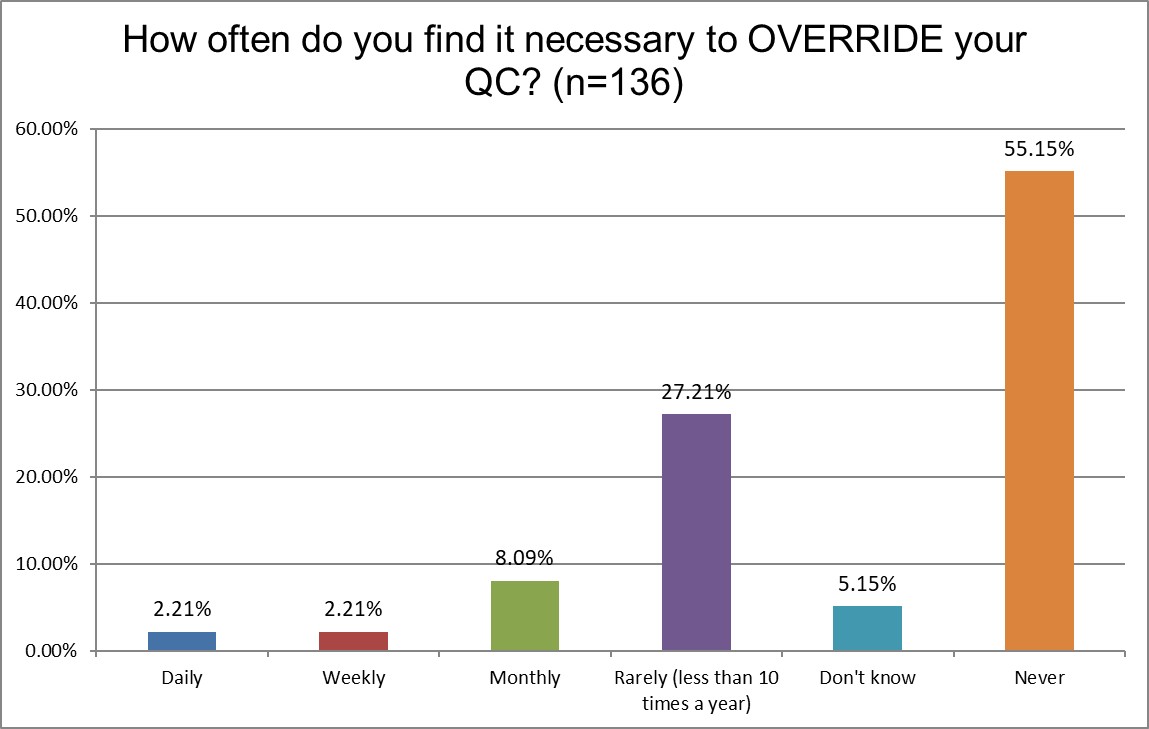
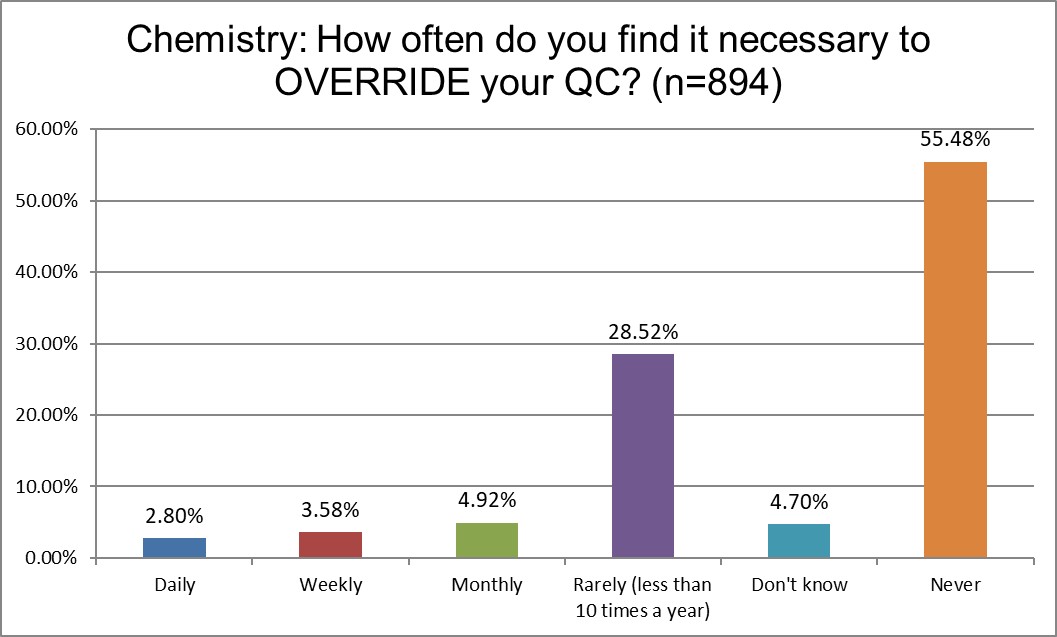
Given the differences in out-of-control frequency, you might expect a similar difference in how they treat QC results and whether they override QC and report results even when there is an out of control event. It's equally unlikely for both sections.
The Final Overview
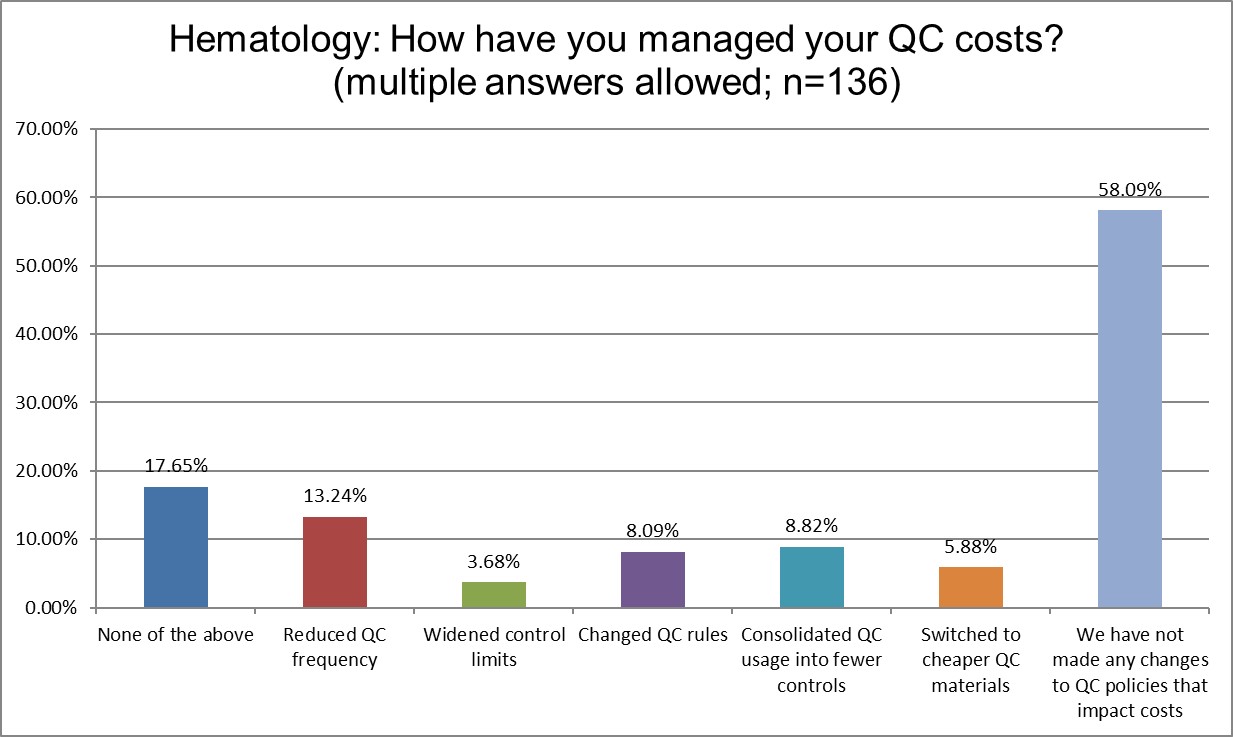
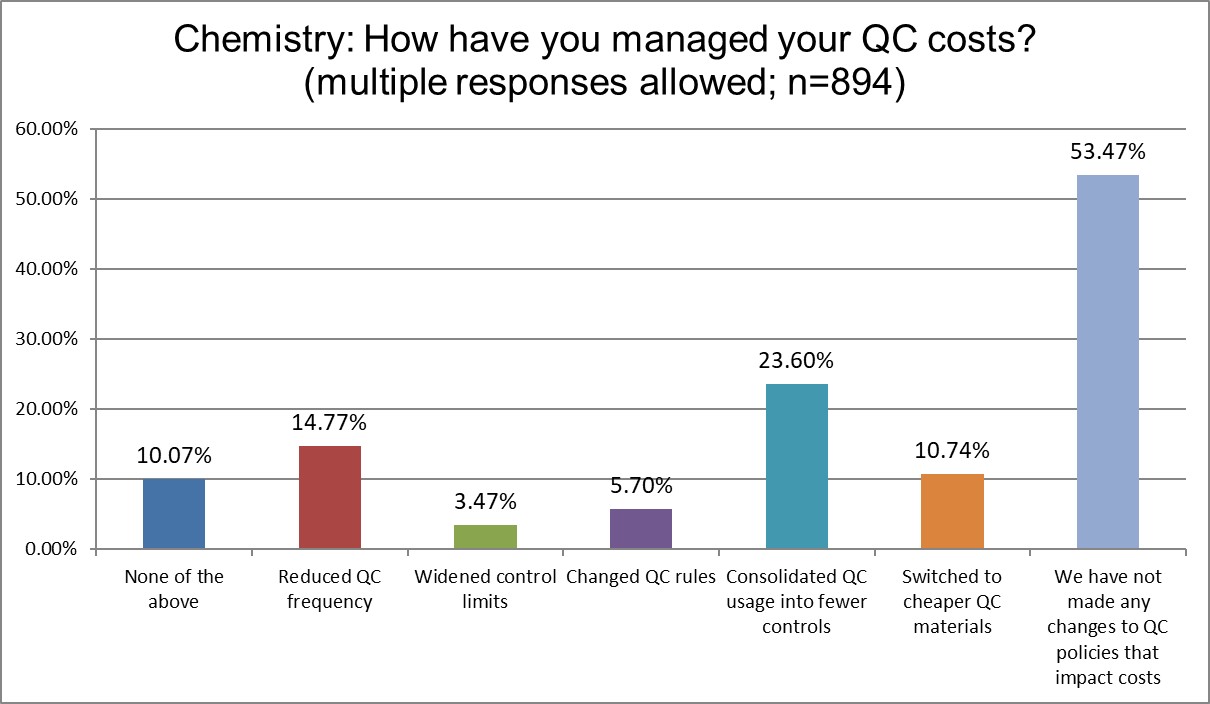
Hematology sections are more likely to have done nothing to manage their QC costs (58.09% vs. 53.47%). Chemistry sections are three times more likely to have switched to consolidated controls than hematology. Chemistry sections are almost twice as likely to have switched to cheaper QC materials (10.74% vs. 5.88%). Some of this may be easily explained by the fact that chemistry sections have more problems, therefore they have been more motivated to make changes than hematology sections.
Conclusion
While chemistry and hematology sections seem to start in the same places with QC rules, they diverge in QC frequency and out-of-control frequency. Paradoxically, hematology sections tend to run more QC but experience fewer out of control events. The use of manufacturer controls and limits probably explain the reason for fewer out of control events, but some factor of the difference may ultimately be ascribed to the quality of the methods. Perhaps it's simply easier to build a great hematology instrument.