Basic QC Practices
The 2025 Great Global QC Survey: Europe in isolation
In 2025, the Westgard Great Global Survey assessed the state of QC practices. Is Europe leading the world? or lagging behind? Or walled off in its own isolation?
The 2025 Global QC Survey Results: Europe gets more European

Sten Westgard, MS
September 2025

[This survey was completed with the support and partnership of Thermo Fisher MAS controls.]
In 2025, have QC practices around the world improved or declined?
We surveyed laboratories in 2017 and 2021 about their quality control practices. We did it again in 2025.
We got over 1,280 responses, which break down as follows:
- Africa 118 responses
- Asia 289 responses (note that we include everywhere from India to Australia within this group)
- Europe 143 responses
- Latin and South America 114 responses
- Middle-east 146 responses
- United States and Puerto Rico 440 responses
Asia: 2025 Great Global QC Survey Results: Asia Breakout - Westgard QC
Europe: The 2025 Great Global QC Survey: Europe in isolation - Westgard QC
Middle-East: 2025 Great Global QC Survey Results: Middle East - Westgard QC
Latin and South America: 2025 Great Global QC Survey Results: South and Latin America - Westgard QC
Africa: 2025 Great Global QC Survey Results: Africa - Westgard QC
USA: https://westgard.com/qc-applications/basic-qc-practices/2025-qc-survey-usa.html
All of it together: https://westgard.com/qc-applications/basic-qc-practices/2025-global-qc-survey.html
Europe has become harder and harder to survey as the years go by. Lab professionals are increasingly reluctant (or too busy?) to respond to surveys and other communication efforts.
One change between 2021 is that in our previous survey, we lumped Australia and Canada into Europe (a kind of "non-US" developed world). This time, the survey for Europe is strictly European.
The demographics of the European participants

A majority of the responses came from supervisors and directors.
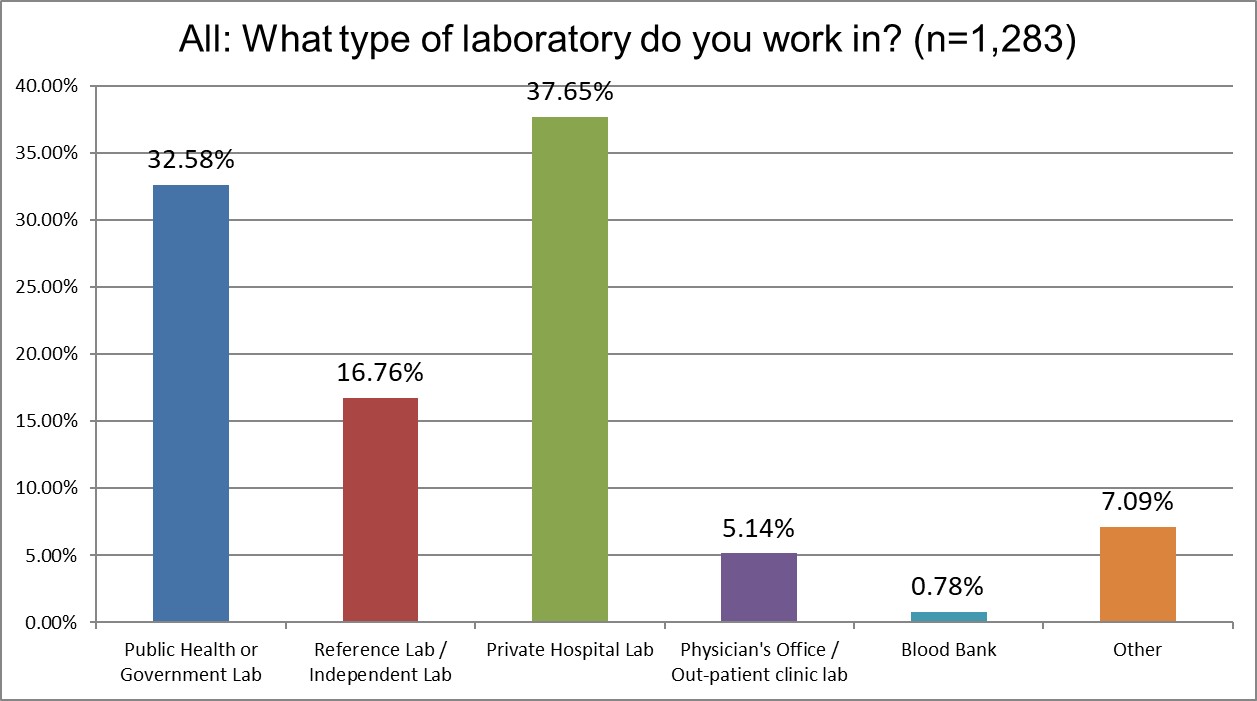
In 2021, almost 60% of the respondents were from public labs, and only 21% were from private labs. Those changed dramatically in this survey. This time around, the results may reflect more of the private laboratory behavior in Europe.

Our European respondents were from higher volume labs. There was a slight increase in the number of very high volume labs responding, from 14% to 17%.

ISO 15189 is only growing stronger and stronger in Europe. In 2021, 49% of responses came from ISO 15189 labs. This year, more than 76%. Local regulations have lost influence - 46% of labs listed "other" regulations, while in this survey that's down to just under 35%. One other change is in the influence of CAP: in 2021, we had almost 9% of responses from CAP accredited labs. This year, just over 2%. Non-European regulations are withering in influence.

The majority of the survey reponses focused on chemistry testing, just slightly more so than in 2021. The previous survey had about 50% of responses focus on biochemistry, while this survey captured just over 55%.
The QC Set Up

The use of 2 SD on all testing has remained almost unchanged from 83% in 2021 (all + some) to 82% in 2025. Traditions stick in Europe.

This is a new question we asked for the 2025 survey, so we don't have a prior result to compare it to. Over 60% of labs in Europe are using 2 SD outliers as rejection limits or rejection and warning combined. As we noted before, the use of 2 SD limits - with its high false rejection rate - is often justified because it's "only" used as a warning. But the data tells us that a majority of labs are using 2 SD for rejection or both warning and rejection. That means the false rejection rate is not being balanced out by warnings that get cleared.

"Westgard Rules" are still in use in over 79% of European laboratories, which marks a decline from 84% in 2021. However, since there are a lot of labs that truly could be doing far fewer Westgard Rules, a decline is not necessarily a bad thing. The biggest increase is coming from labs that don't use any Westgard Rules, up from 10% in 2021 to 18% in 2025.
.

Happily, we see that the use of actual mean and SD has increased from 45% (2021) to almost 60%. Also a decrease in the use of manufacturer ranges from 64% (2021) to 44% is pretty significant. The recommendation from ISO 15189:2022 to use 3rd party controls (when possible) may be having some impact.

The greatest influence on QC comes from ISO 15189, which dramatically increased from 66% in 2021 to over 88% today. CAP and other US accreditation guidelines declined from 9% in 2021 to just under 3% in 2025. Europe likes listening to European guidance on QC, even if that means following rather vague advice. The most specific advice on QC, CLSI C24, has gained a very modest influence, from 8.4% in 2021 to 13.29% in 2025.

The use of 3rd party liquid, assayed controls has increased only slightly, from about 47% in 2021 to 50% in 2025. The use of manufacturer controls has declined from 72% to 65%, another modest move toward best practices. However, Europe still leads the world in using manufacturer controls, despite ISO 15189:2022 strongly encouraging labs to use independent controls. Patient data QC, also notably, has declined from 16.67% in 2021 down to 11.89% in 2025.

The percentage of labs not using patient data QC has slightly increased from 59% in 2021 to 62.9% in 2025. In 2021, almost 13% of labs said they used patient data QC for a significant part of their menu. In 2025, that's held steady, unlike declines we've seen in most other parts of the world. While patient data might be a boutique technique that is rare to be used, in Europe there are still bastions where the practice continues. Nevertheless, for over 85% of labs in Europe, patient data techniques are being used on only a tiny minority of tests.
The Real Practice of Running Controls

Running three times a day QC significantly increased from 27% in 2021 to 37% in 2025, one of the few areas of the world where this happened. Yet running QC once a day declined from 48% down to 36%. Running QC 2x a day also increased from 26% in 2021 to 30% in 2025. Is there a reason why Europe has been running more controls? Perhaps as their lab volumes increase, the frequency of QC needs to increase? Or the sales reps for the control vendors are very good at their jobs in Europe? One other thought: if labs are running manufacturer controls, these tend to be "free" and thus there are fewer impulses to run them sparingly.

Interestingly, the percentage of labs repeating the control once has modestly increased (69% in 2021, now 73% in 2025), but the running of a new control and the repeating of that control have stayed the same. The % of labs that keep repeating and repeating until they get the result to fall "in" more than doubled, from 2.5% in 2021 to 6.3% in 2025. Europe is not only running more controls, they are repeating more controls. More distressingly, the number of labs that troubleshoot and seek root cause has fallen from 75% in 2021 down to 70.6% in 2025. European troubleshooting habits are on the decline.

More disturbingly, European labs are experiencing significantly more oocs (out-of-control events) than ever before.
In 2021, 14.7% of labs said they were ooc more than once a day. Now that's 23.78% in 2025. Even the % of labs that have an ooc every few days has increased: from 21.79% in 2021 to 27.97% in 2025.
This adds up to a major increase in out of control episodes. In 2021, 27% of labs were ooc every day and/or multiple times per day. In 2025, it's over 37%.
Let's restate that: more than one third of European labs are out of control every day.
Running more controls more frequently = more out of control events = more troubleshooting = more expense for everyone. The control vendors are happy, of course, because this is extra profit.

A little bit less than a third of labs will retest all patient samples when there is an out of control run, slightly down from the 2021 survey, which found 35% would do so. The other numbers did not change significantly from 2021 to 2025.

The good news is that the number of labs that report test results even when there's an out of control run has slightly declined. In 2021, over 10% of labs said they did this on a regular basis (daily and weekly). In 2025, that's now down to 7%. Not a huge decline, but progress.

This question about bias uncertainty, or more correctly, the measurement uncertainty around the correction of bias, is a new one to the 2025 survey. The cutting edge of measurement uncertainty is how to incorporate bias into the overall uncertainty. Only 11% of European labs state they do not calculate mu at all. But a majority of labs do not take bias into account in their mu, a glaring omission. Just under 30% of European labs do some limited inclusion of bias in their mu. As so often happens, mu is given lip service, but when it comes to practical reality, it is often ignored.
The Final Overview

More labs have addressed their QC costs since 2021. In our previous survey, 60.9% of European labs said they hadn't done anything. In 2025, it's now 55%, a small decrease. More labs have consolidated QC into fewer controls, (from 15% in 2021 to almost 20% in 2025). In 2021, about 7% of labs switched to cheaper controls, now that's 9% (probably not a significant difference). As our earlier findings indicated, the number of labs that have reduced QC frequency rules declined from 13.25% in 2021 to 9.09% in 2025. Labs in Europe are increasing, not decreasing, QC frequency.
Finally, a majority of European labs around the world have still done nothing to change how they do QC and how much they spend on it. Or actually, they have increased running QC and repeating controls and responding to repeats with even more repeats. QC is getting more expensive in Europe, but not necessarily any better.