
Sigma Metric Analysis
A Sysmex XR-20 in Belgium
A recent study of the Sysmex XR-20 in Belgium found that it's performance was acceptable according to EFLM and Ricos criteria. But what if the instrument was held to the CLIA 2025 standard?
A Sysmex XR-20 in Belgium
May 2026
Sten Westgard, MS
[Sigma quality score: +0.5 for control levels at medical decision levels (abnormal, normal); +0.5 bias measured using patient samples; +1 goals used from biological evaluation (EFLM, Ricos). Final score: 2 = Optimistic.]
A recent study from ZA Zint-Lucas Hospital in Bruges, Belgium examined the performance of the Sysmex XR-20 analyzer:
Evaluating the Perforamnce of th eNew Sysmex XR-Series Haematology Analyser: A Comparative Study with the Sysmex XN-series. Amber Coussee, Johan Robbrecht, Karel Maelegheer, Wouter Vandewal, Lisa Florin. LabdMed 2025;2,5 https://doi.org/10.3390/labmed2010005.
Calculating Sigma metrics from routine laboratory performance data.
The imprecision and bias of the analyzers
"Between-run imprecision, bias, and total error were assessed by analysing level 1 and 2 aof Sysmex XN Check quality control material on 6 different days." bias was determined through "388 residual fresh K2EDTA-anticoagulated patient samples... previously analysed during routine practice on one of the Sysmex XN-2000 analysers were analysed according to the manufacturer's instructions within 2 h after collection, on the Sysmex XR-analyser by a dedicated technologist."
We used the CLIA 2025 goals here for benchmarking, but for analytes not directly regulated by CLIA, we use the ESFEQA and EFLM goals.
| XR-20 parameter | TEa Source | TEa | Mean | slope | y-intercept | New lab mean | Bias in Units | % Bias | % CV |
| Hemoglobin | CLIA 2025 4% | 4 | 5.90 | 1.00 | -0.1 | 5.8 | 0.1 | 1.72 | 1.96 |
| Hemoglobin | 4 | 12.00 | 1.00 | -0.1 | 11.9 | 0.1 | 0.84 | 2.02 | |
| Hematocrit | CLIA 2025 4% | 4 | 18.20 | 1.01 | 0.0 | 18.41 | 0.21 | 1.14 | 2 |
| Hematocrit | 4 | 35.80 | 1.01 | 0.0 | 36.18 | 0.38 | 1.07 | 1.73 | |
| MCV | ESFEQA 10% | 10 | 69.10 | 0.98 | 0.9 | 68.58 | 0.52 | 0.76 | 0.79 |
| MCV | 10 | 82.10 | 0.98 | 0.9 | 81.32 | 0.78 | 0.96 | 0.85 | |
| MCH | ESFEQA 9% | 9 | 22.40 | 0.96 | 0.3 | 21.75 | 0.65 | 2.97 | 1.73 |
| MCH | 9 | 27.50 | 0.96 | 0.3 | 26.65 | 0.85 | 3.19 | 1.4 | |
| MCHC | ESFEQA 7% | 7 | 32.40 | 1.00 | -0.7 | 31.7 | 0.7 | 2.21 | 1.35 |
| MCHC | 7 | 33.60 | 1.00 | -0.7 | 32.9 | 0.7 | 2.13 | 1.11 | |
| Platelets | CLIA 2025 25% | 25 | 93.00 | 1.03 | 0.8 | 96.58 | 3.58 | 3.71 | 2.75 |
| Platelets | 25 | 259.00 | 1.03 | 0.8 | 267.56 | 8.56 | 3.20 | 1.67 | |
| RBC | CLIA 2025 4% | 4 | 2.60 | 1.02 | 0.0 | 2.65 | 0.052 | 2.0 | 1.9 |
| RBC | 4 | 4.40 | 1.02 | 0.0 | 4.49 | 0.088 | 2.0 | 1.31 | |
| WBC | CLIA 2025 10% | 10 | 2.90 | 0.98 | 0.0 | 2.85 | 0.048 | 1.68 | 3.36 |
| WBC | 10 | 7.00 | 0.98 | 0.0 | 6.87 | 0.13 | 1.89 | 1.84 | |
| Lymphocytes | EFLM 2026 min 22.4% | 22.4 | 1.08 | 0.99 | 0 | 1.07 | 0.01 | 1.01 | 5.21 |
| Lymphocytes | 22.4 | 2.23 | 0.99 | 0 | 2.21 | 0.02 | 1.01 | 2.71 | |
| Monocytes | EFLM 2026 min 27.4% | 27.4 | 0.26 | 1 | -0.01 | 0.25 | 0.01 | 4.0 | 8.31 |
| Monocytes | 27.4 | 0.63 | 1 | -0.01 | 0.62 | 0.01 | 1.61 | 5.04 | |
| Eosinophils | EFLM 2026 min 44.6% | 44.6 | 0.28 | 1 | 0 | 0.28 | 0 | 0 | 8.14 |
| Eosinophils | 44.6 | 0.75 | 1 | 0 | 0.75 | 0 | 0 | 8.41 | |
| Basophils | EFLM 2026 min 27.3% | 27.3 | 0.14 | 1 | 0 | 0.14 | 0 | 0 | 6.49 |
| Basophils | 27.3 | 0.34 | 1 | 0 | 0.34 | 0 | 0 | 2.77 | |
| Neutrophils | EFLM 2026 min 26.3% | 26.3 | 1.16 | 0.98 | 0 | 1.14 | 0.02 | 2.04 | 2.75 |
| Neutrophils | 26.3 | 3.07 | 0.98 | 0 | 3.01 | 0.06 | 2.04 | 2.77 |
The analytical Sigma-metrics that result from this data are as follows:
| XR-20 | Analytical Sigma-metric |
| Hemoglobin | 1.16 |
| Hemoglobin | 1.56 |
| Hematocrit | 1.43 |
| Hematocrit | 1.69 |
| MCV | 11.69 |
| MCV | 10.63 |
| MCH | 3.49 |
| MCH | 4.15 |
| MCHC | 3.55 |
| MCHC | 4.39 |
| Platelets | 7.74 |
| Platelets | 13.05 |
| RBC | 1.05 |
| RBC | 1.53 |
| WBC | 2.48 |
| WBC | 4.41 |
| Lymphocytes | 4.11 |
| Lymphocytes | 7.89 |
| Monocytes | 2.82 |
| Monocytes | 5.12 |
| Eosinophils | 5.48 |
| Eosinophils | 5.30 |
| Basophils | 4.21 |
| Basophils | 9.86 |
| Neutrophils | 8.82 |
| Neutrophils | 8.76 |
We can see some parameters are doing great, particularly the differentials. But RBC, hemoglobin and hematocrit are below 2 sigma. Where CLIA 2025 goals are most strict, the XR-20 falters.
Graphic Display of performance by Normalized Method Decision Chart (NMEDx)
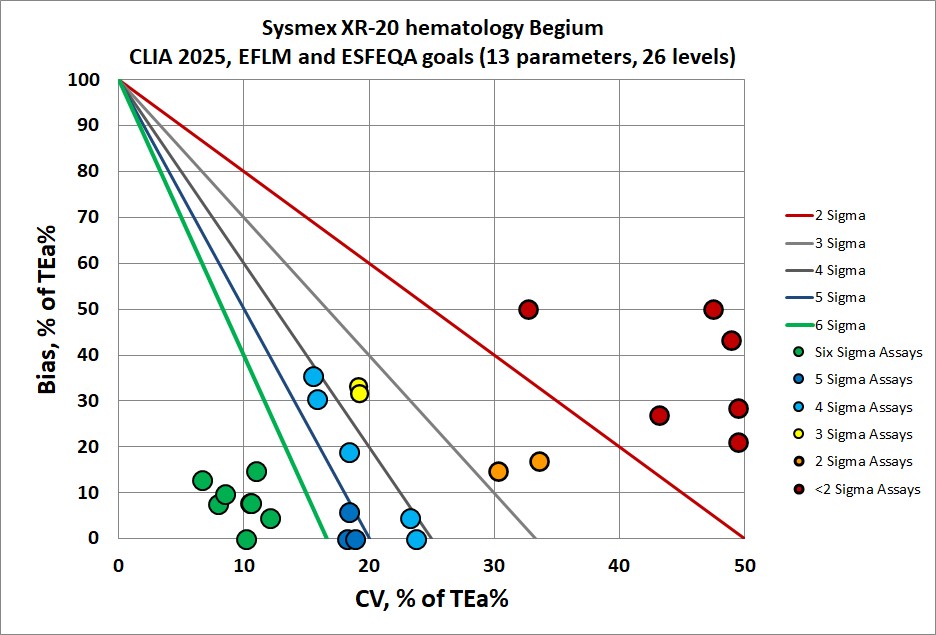
About a third of the performance here is in the unacceptable zone, if we take the CLIA 2025 goals. The XR-20 is much better at hitting ESFEQA and EFLM goals.
Conclusion
The authors of the study concluded: "Overall, Sysmex XR is an excellent successor to the Sysmex XN for routine hematology analysis. Analytical performance and flagging efficiency are comparable to the XN analyser."
Through the lens of CLIA 2025 goals, we see that XR-20 is not perfect. For several of the key parameters, performance is extremely low, will require extensive Westgard Rules to monitor. This shows again that CLIA 2025 hematology goals are extremely demanding for hemoglobin, hematocrit, and RBC. And this study was an optimistic one, with shorter evaluation times and ideal comparison circumstances. A more robust study might find performance is even less acceptable.