Basic QC Practices
2025 Great Global QC Survey Results: Asia Breakout
In 2025, the Westgard Great Global Survey assessed the state of QC practices. How far has Asia advanced in QC practices? Has it overtaken the world yet?
The 2025 Global QC Survey Results: Asia breakout
Sten Westgard, MS
September 2025

[This survey was completed with the support and partnership of Thermo Fisher MAS controls.]
In 2025, have QC practices around the world improved or declined?
We surveyed laboratories in 2017 and 2021 about their quality control practices. We did it again in 2025.
We got over 1,280 responses, which break down as follows:
- Africa 118 responses
- Asia 289 responses (note that we include everywhere from India to Australia within this group)
- Europe 143 responses
- Latin and South America 114 responses
- Middle-east 146 responses
- United States and Puerto Rico 440 responses
Asia: 2025 Great Global QC Survey Results: Asia Breakout - Westgard QC
Europe: The 2025 Great Global QC Survey: Europe in isolation - Westgard QC
Middle-East: 2025 Great Global QC Survey Results: Middle East - Westgard QC
Latin and South America: 2025 Great Global QC Survey Results: South and Latin America - Westgard QC
Africa: 2025 Great Global QC Survey Results: Africa - Westgard QC
USA: https://westgard.com/qc-applications/basic-qc-practices/2025-qc-survey-usa.html
All of it together: https://westgard.com/qc-applications/basic-qc-practices/2025-global-qc-survey.html
Asia includes a wide range of economies and practices, from "1st world" Australia, to far more developing economies.
The demographics of the Asian participants
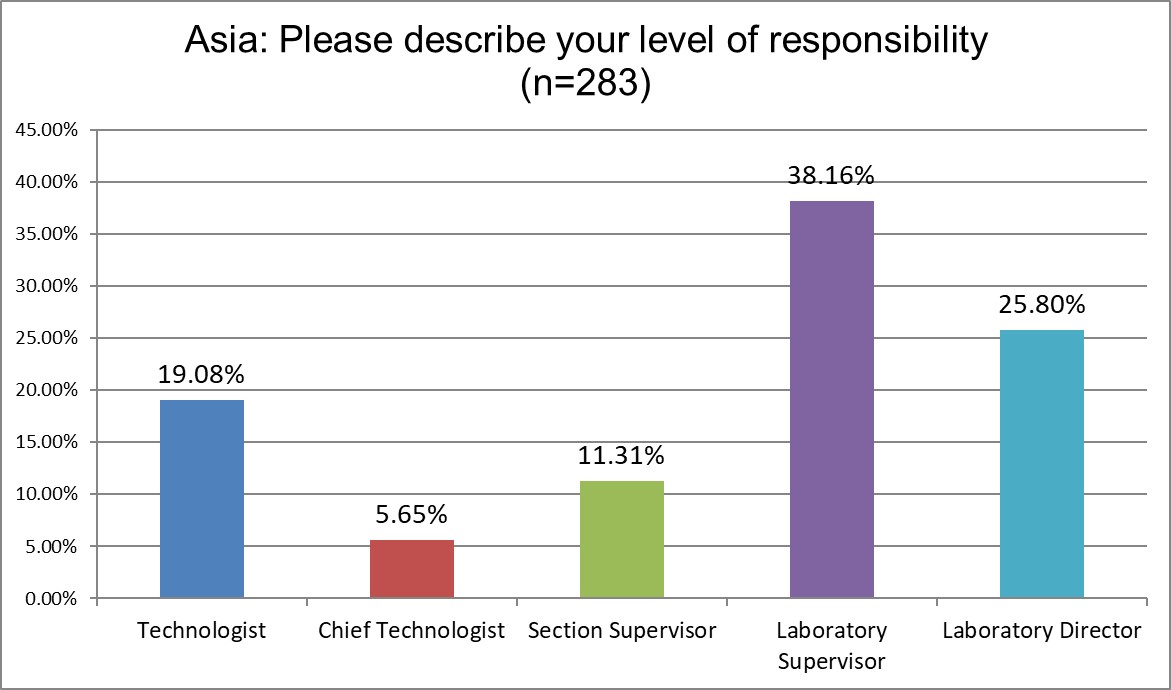
A majority of the responses came from supervisors and directors.
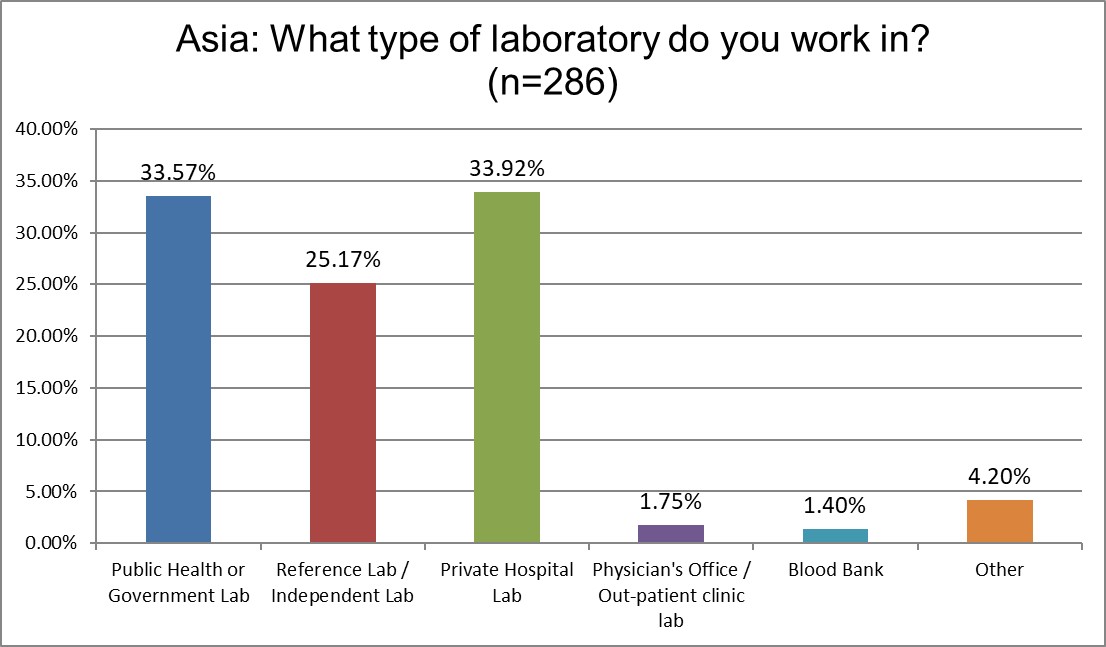
In 2021, over 40% of the respondents were from public labs, and only 23% were from private labs. Those changed significantly in this survey. This time around, the results may reflect more of the private laboratory behavior in Asia.
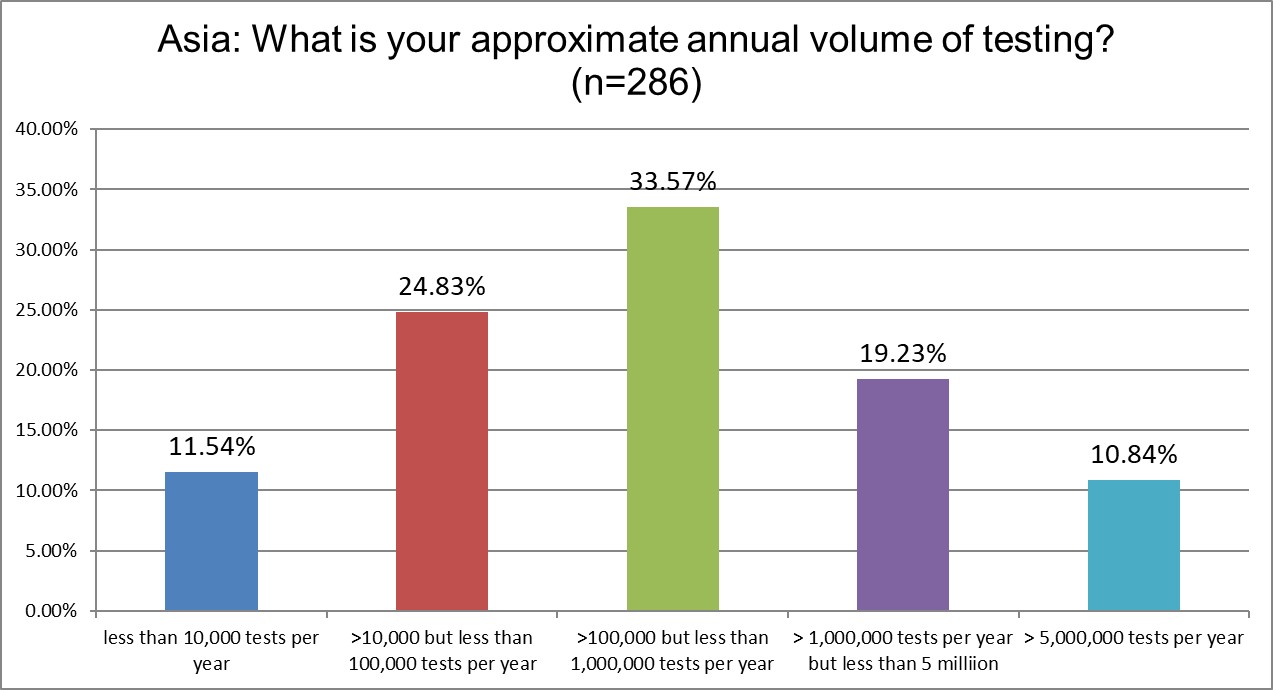
Our Asia respondents had slightly lower volume labs than we see in US and Europe. 10% of labs fall into the "supermax" category. The major change we see from 2021 to 2025 is that the % of labs running 10k-100k tests/year declined from 35% down to 24%. But half of that change when to even lower volume labs running less than 10k tests /year (increased from 5% in 2021 to 11% in 2025), and the other gains went to mid-volume labs (31% in 2021 up to 33.57% in 2025) and the supermax labs (from 8% in 2021 up to 10.84% in 2025).
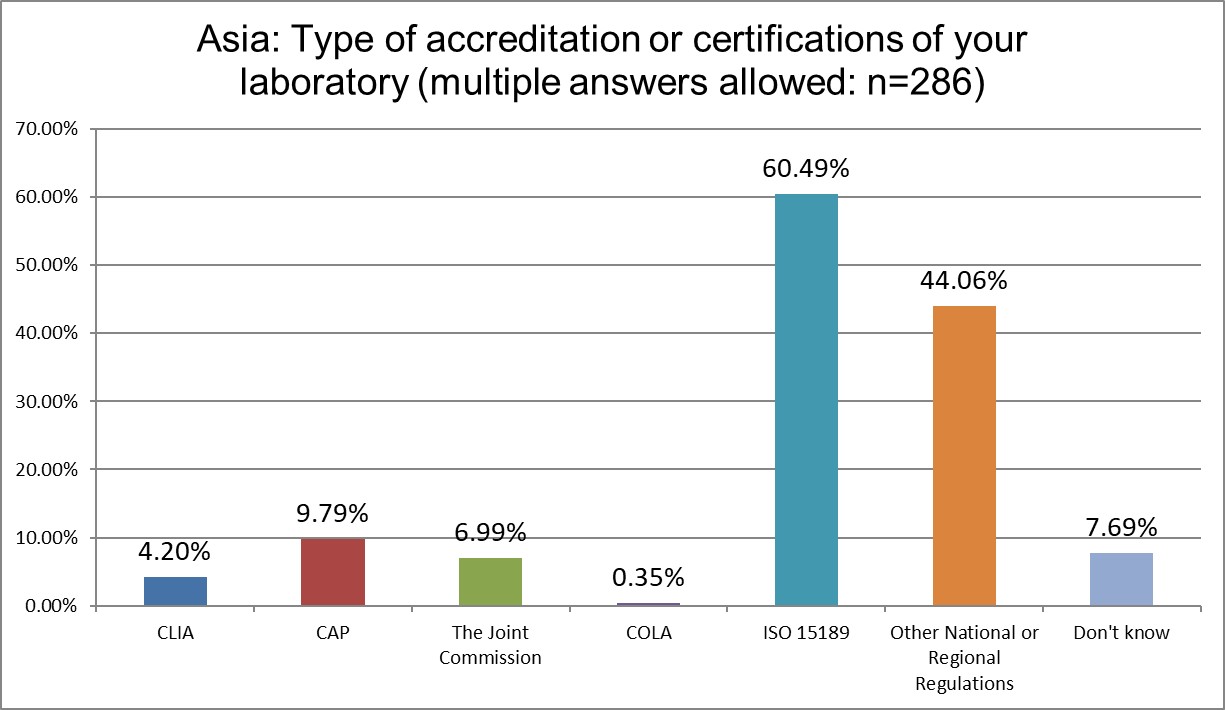
ISO 15189 dominates Asia, increasingly so. In 2021, 55% of labs had ISO 15189 accreditation. In 2025, that's exceeded 60%. The influence of TJC has increased from 2.7% in 2021 up to 6.99% in 2025.
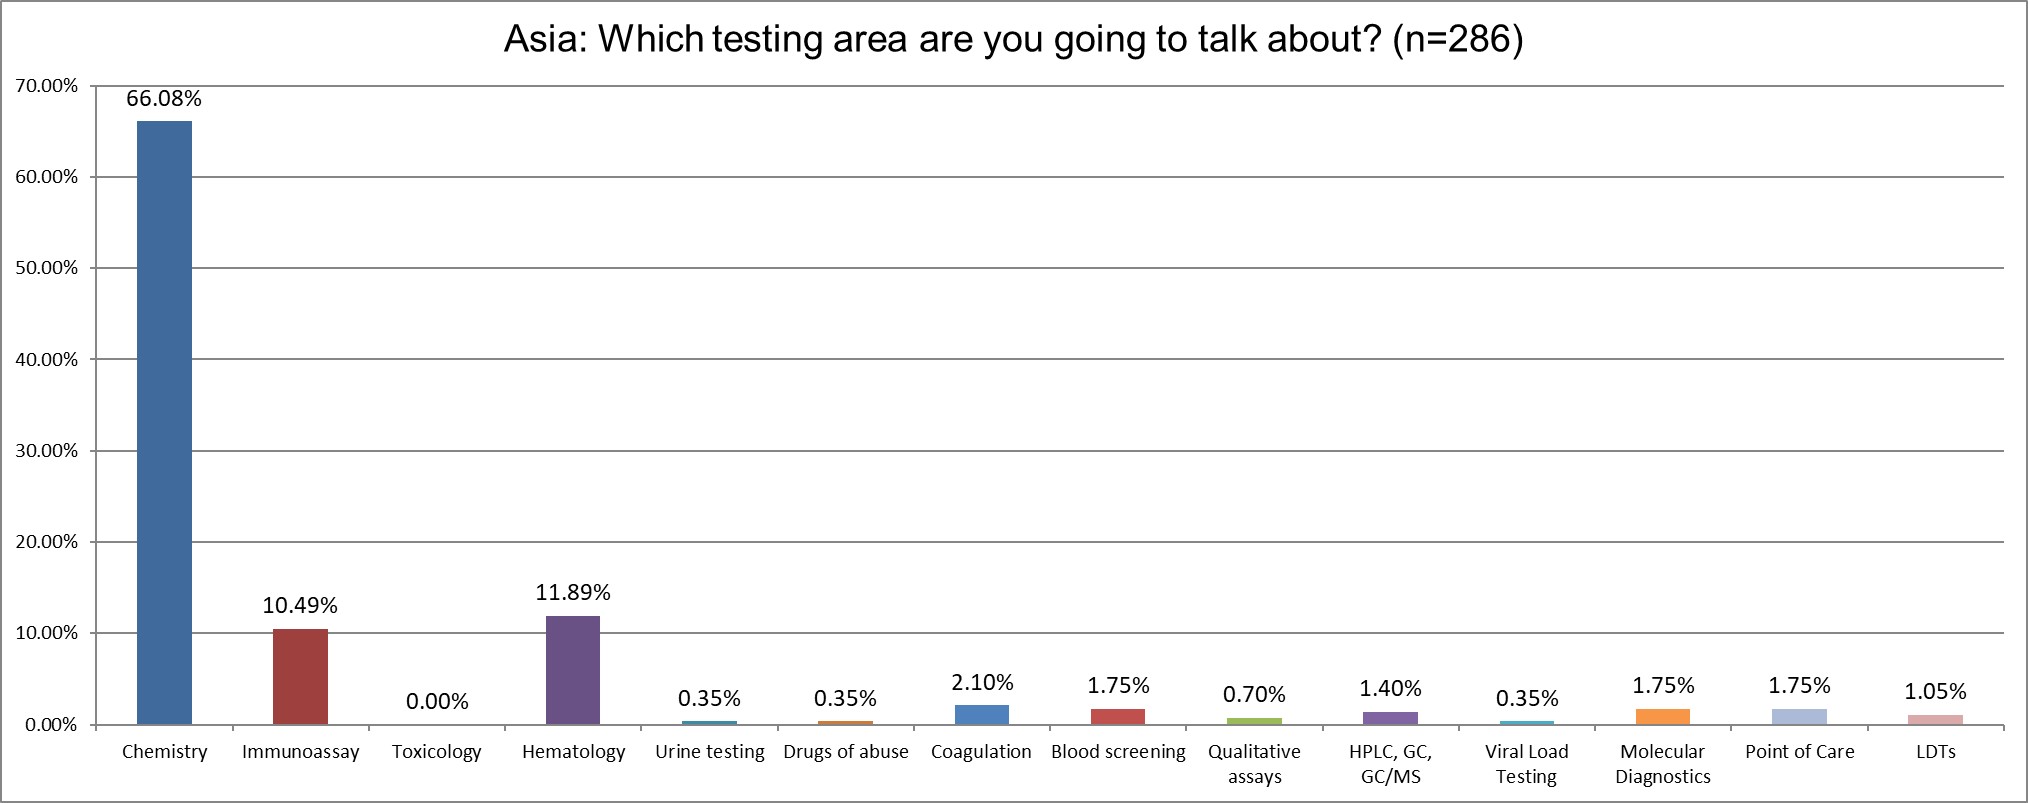
The majority of the survey reponses focus on chemistry testing, increasing from 49% in 2021.
The QC Set Up
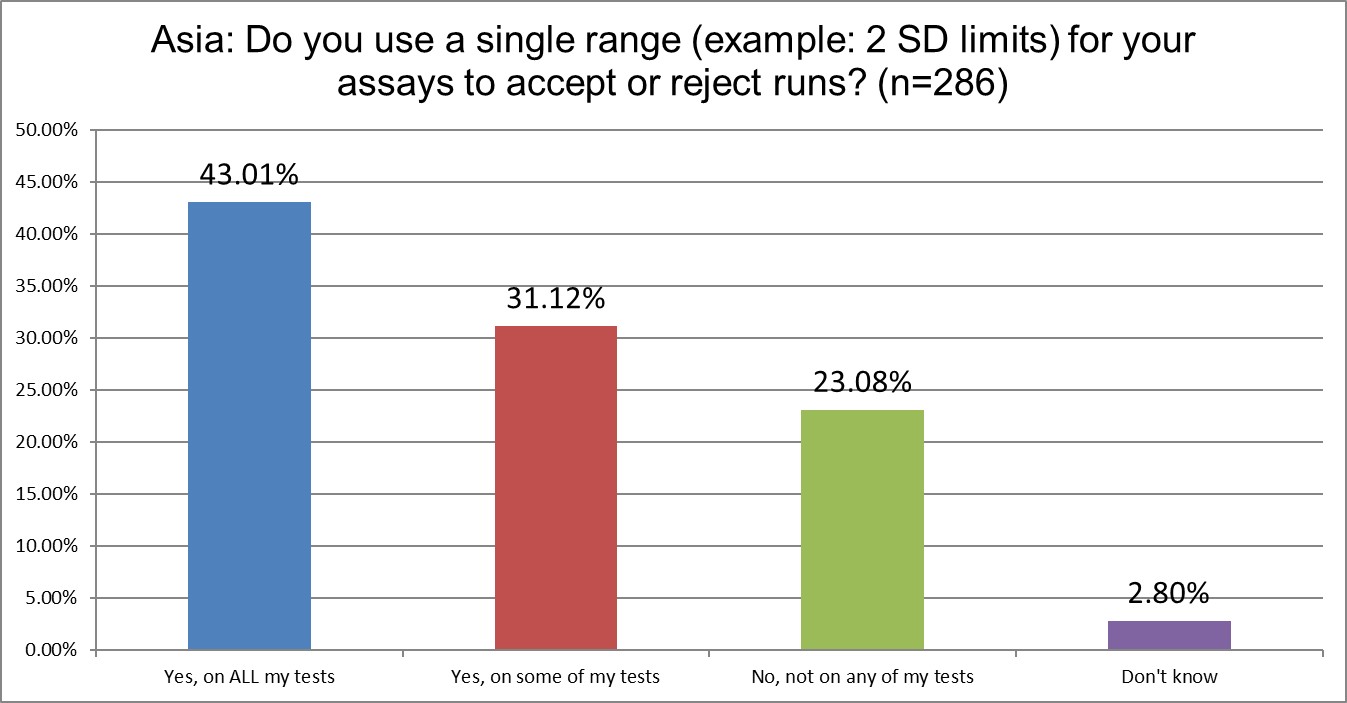
The use of 2 SD on all testing is far less common in Asia than in the US and Europe. Perhaps not all of our bad habits rubbed off on them. Better still, it seems to be declining. In 2021, 87% of labs reported using 2 SD on some or all of their tests. Now that is only 74%.
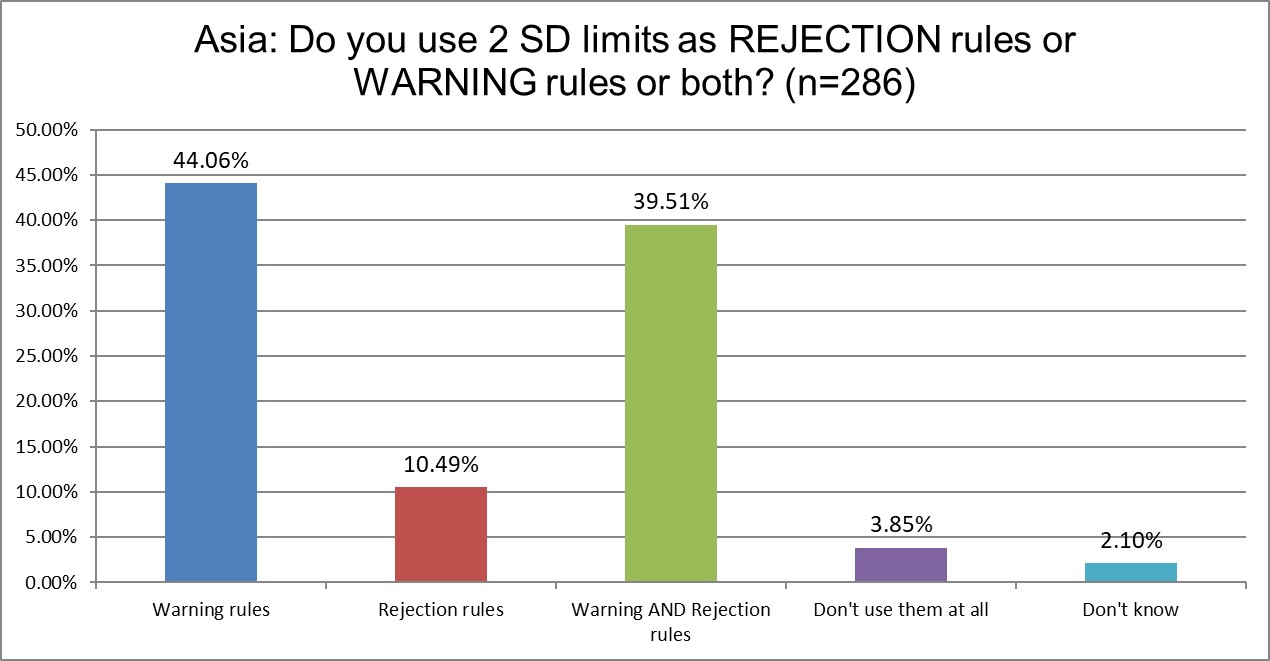
This is a new question we asked for the 2025 survey, so we don't have a prior result to compare it to. Under 50% of labs in Asia are using 2 SD outliers as rejection limits for rejection and/or warning. The use of 2 sd for rejection is at a global low in Asia. Again, a bad habit from the 1st world not being replicated here.
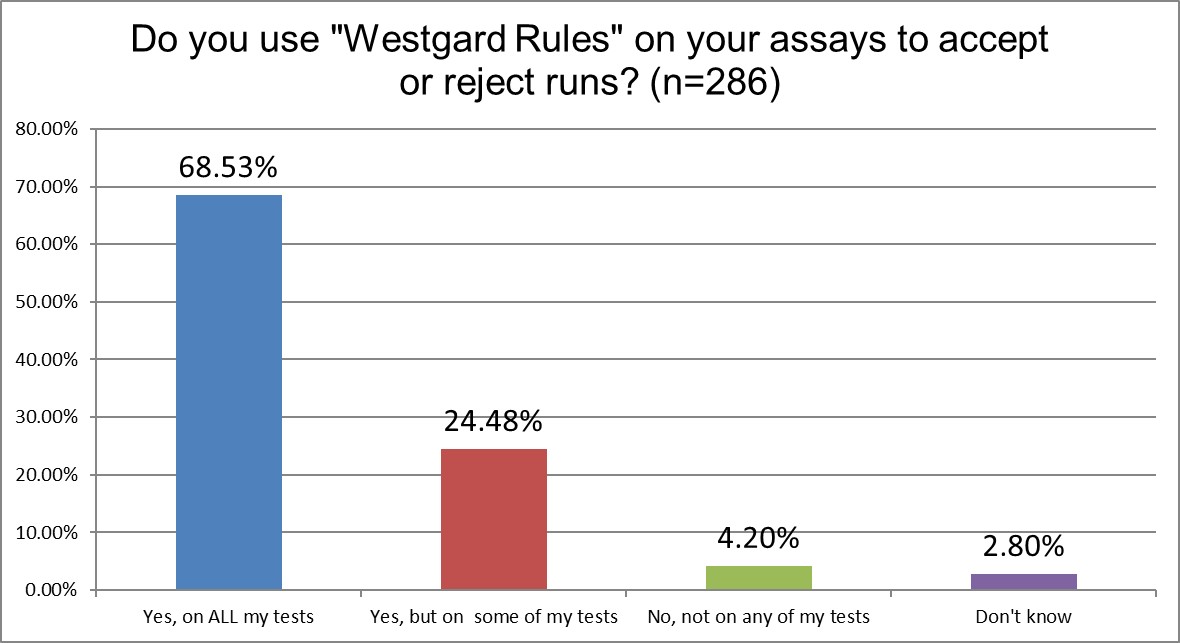
"Westgard Rules" are in use in over 93% of Asian laboratories. This is an increase over the findings from 2021, when it was only 87%. The increase occurred mainly in labs that use Westgard Rules on all of their tests, which went up from 63% in 2021 to 68% in 2025. However, since there are a lot of labs that truly could be doing far fewer Westgard Rules, this high percentage is not necessarily great news.
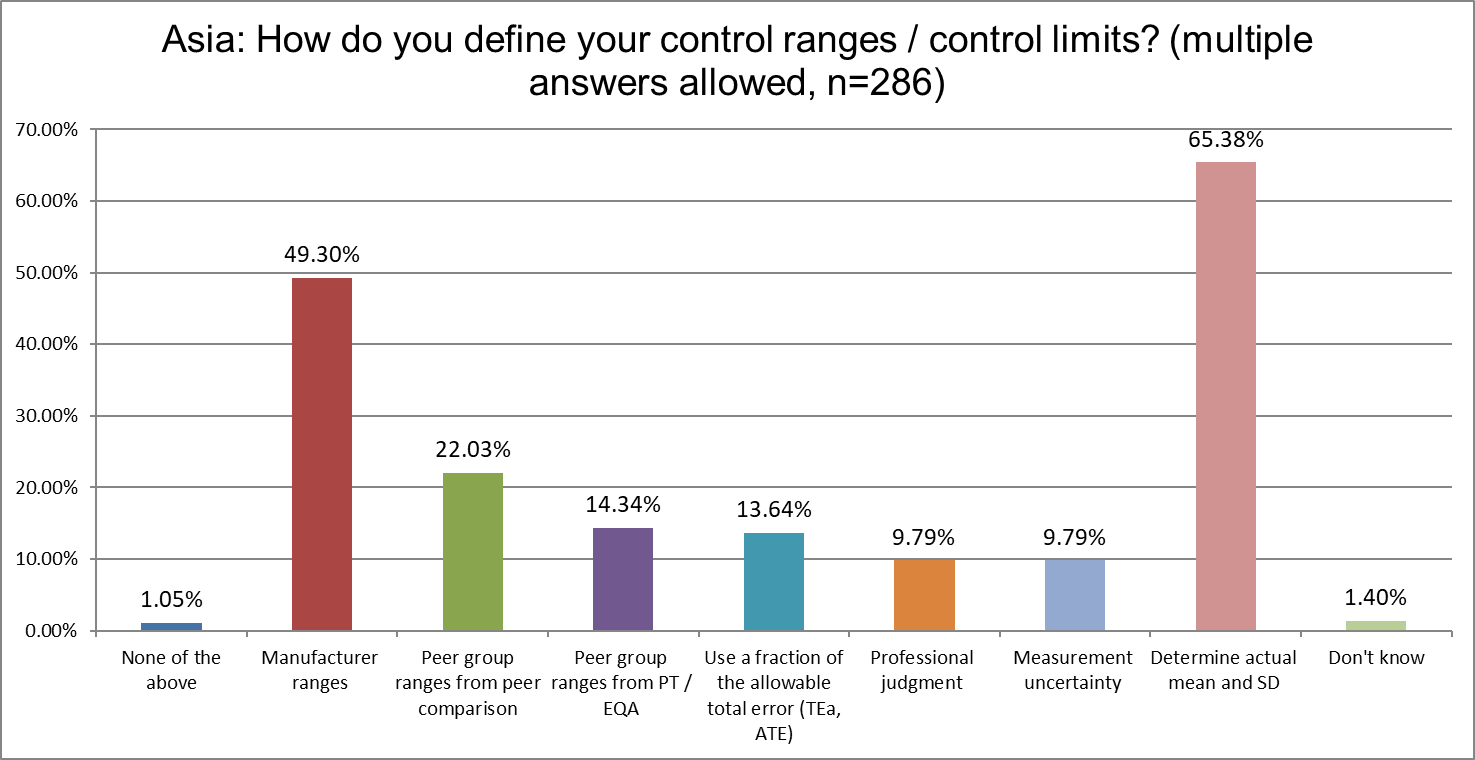
Remarkably, there has been almost no change in how labs in Asia define their ranges and limits between 2021 and 2025. These current results are nearly identical to what we saw 4 years ago. Having 2/3 of labs calculate their own mean and SD is a great thing. Having almost a majority of those labs also use manufacturer ranges, not so much. Manufacturer ranges are known to be too wide, resulting in a loss of error detection.
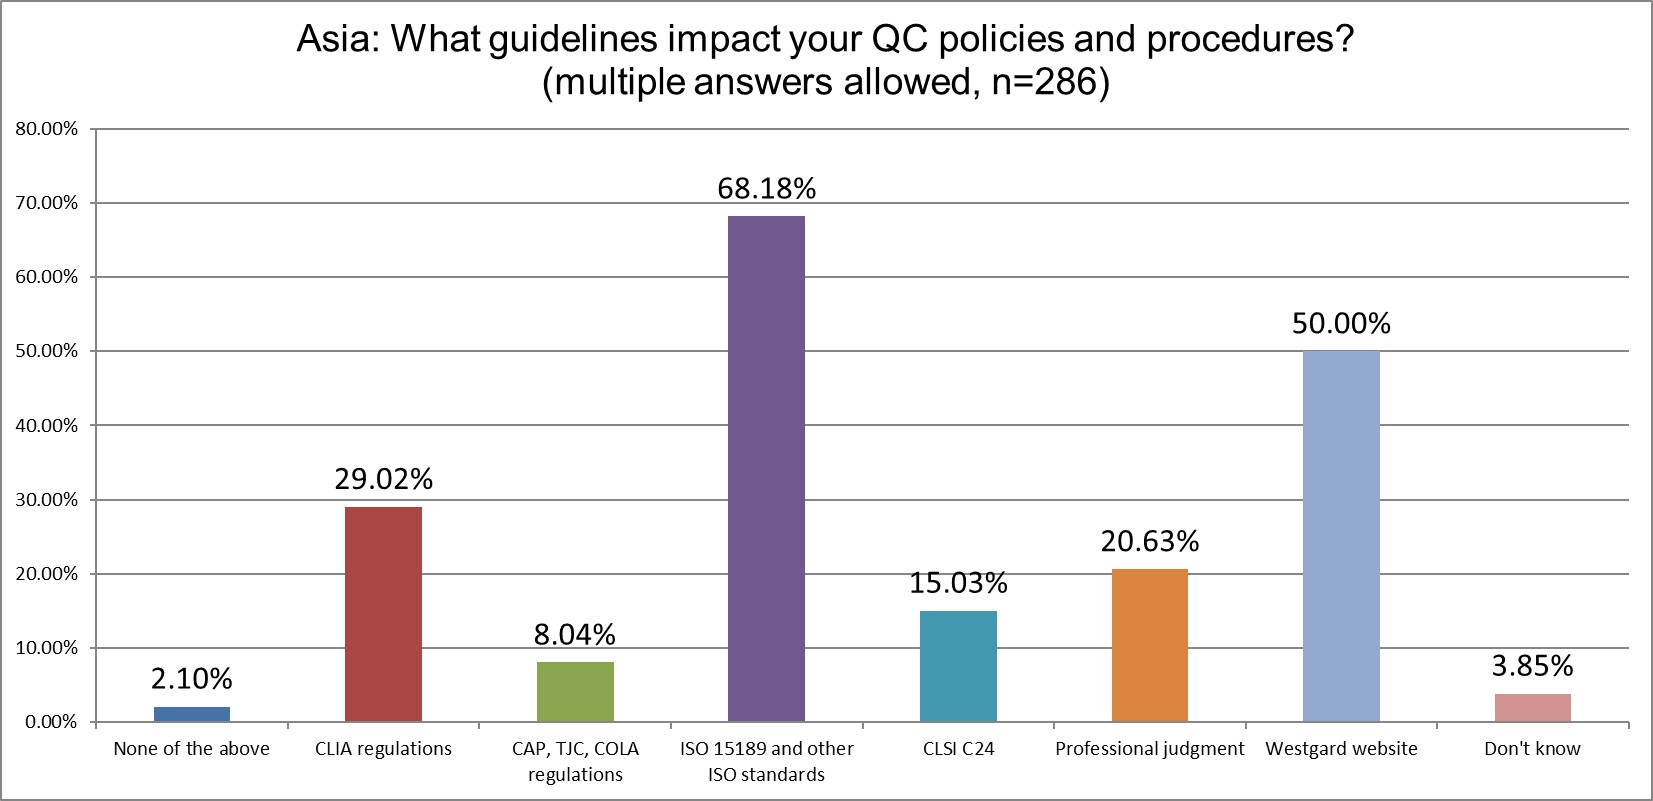
The greatest influence on QC comes from ISO 15189, which is almost the same as we found in 2021 (69% in 2021 vs 68% in 2025). CLIA increased its influence from 20% in 2021 to 29% in 2025. Europe likes listening to European guidance on QC, even if that means following vague advice. The most specific advice on QC, CLSI C24, has gained a very modest influence, from 10% in 2021 to 15% in 2025.
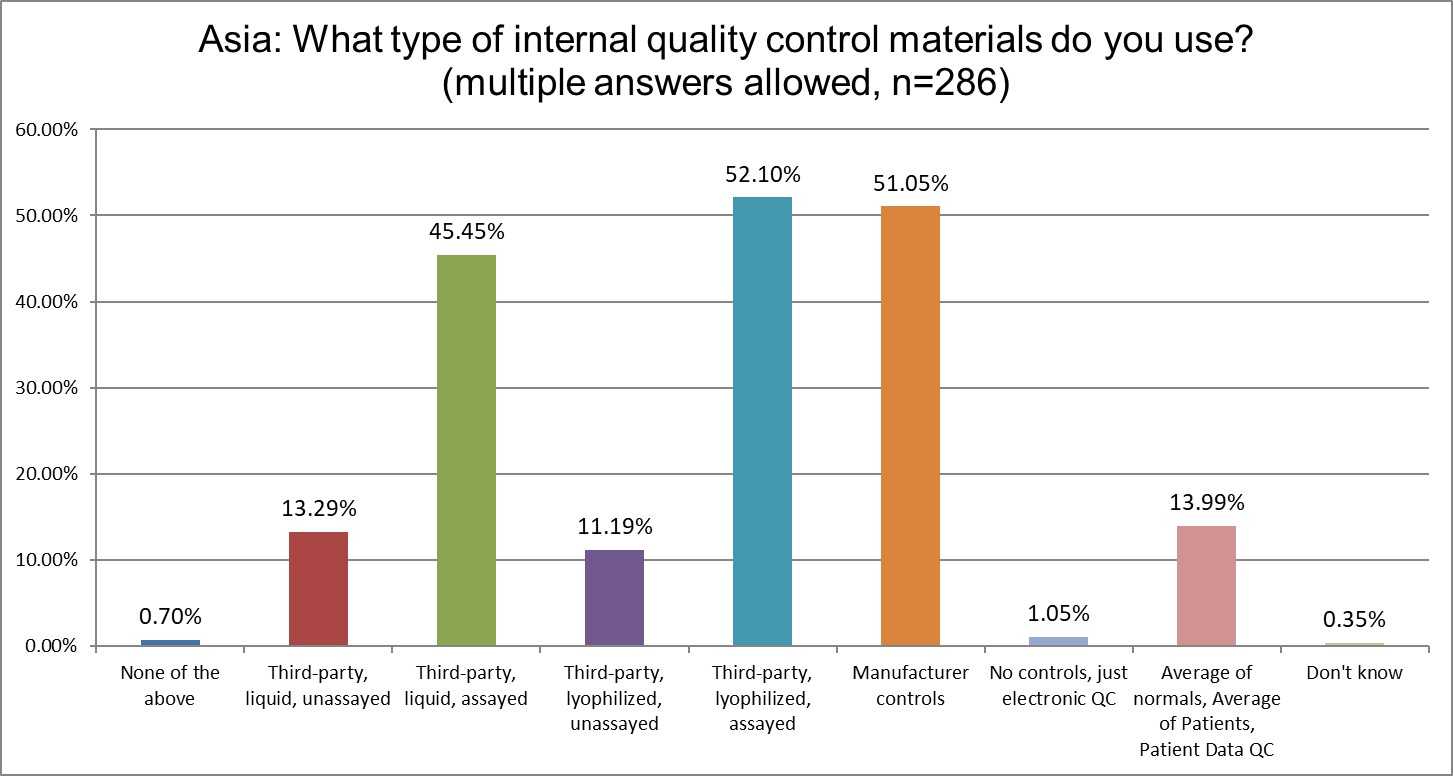
The largest increases in use are coming in 3rd party liquid assayed (35% in 2021 to 45% in 2025) and 3rd party lyophilyzed assayed (35% in 2021 to 52% 2025). The use of manufacturer controls has declined from 66% to 51%, another significant move toward best practices. Patient data QC, notably, has declined from 19.57% in 2021 down to 14% in 2025.
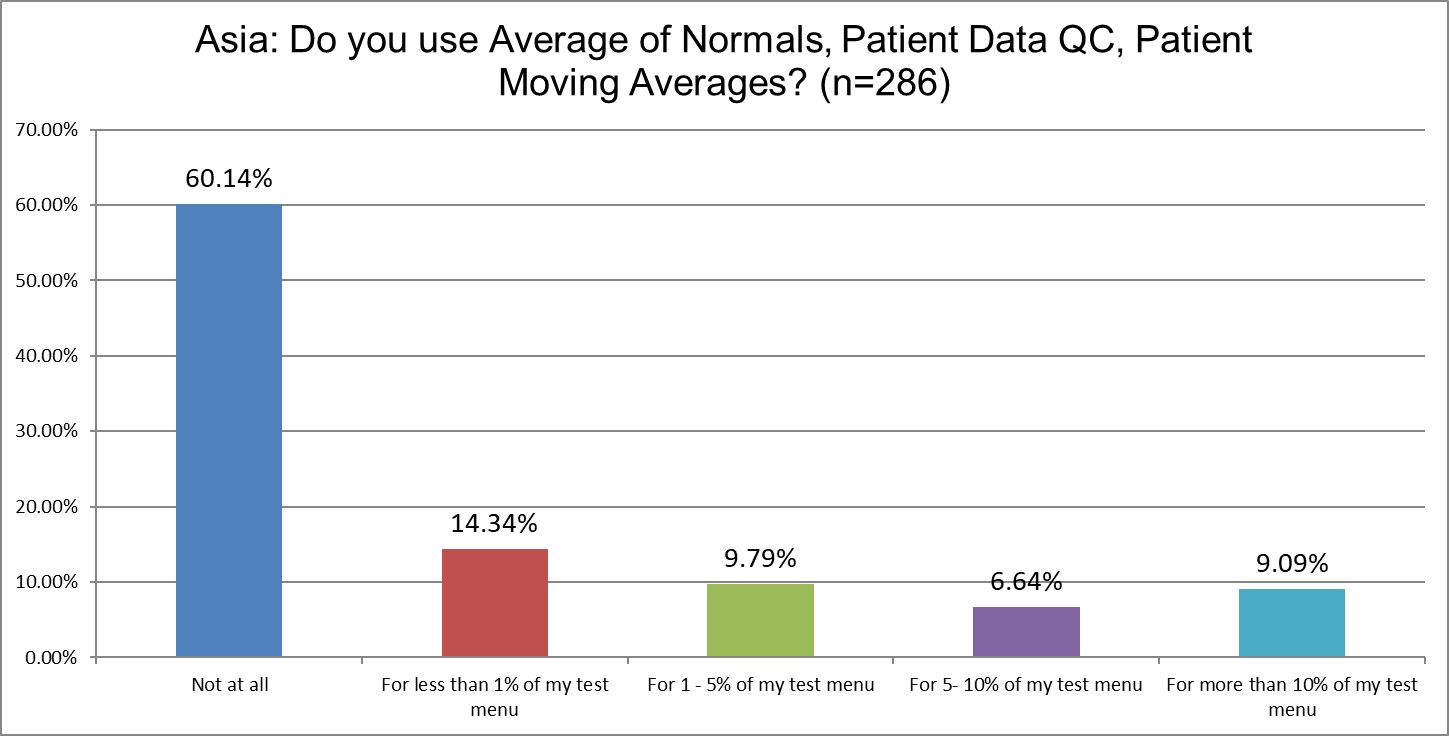
The percentage of labs not using patient data QC has slightly increased from 51% in 2021 to 60% in 2025. In 2021, almost 12% of labs said they used patient data QC for a significant part of their menu. In 2025, that's declined to just 9%. As in most parts of the world, patient data techniques are being used on only a tiny minority of tests.
The Real Practice of Running Controls
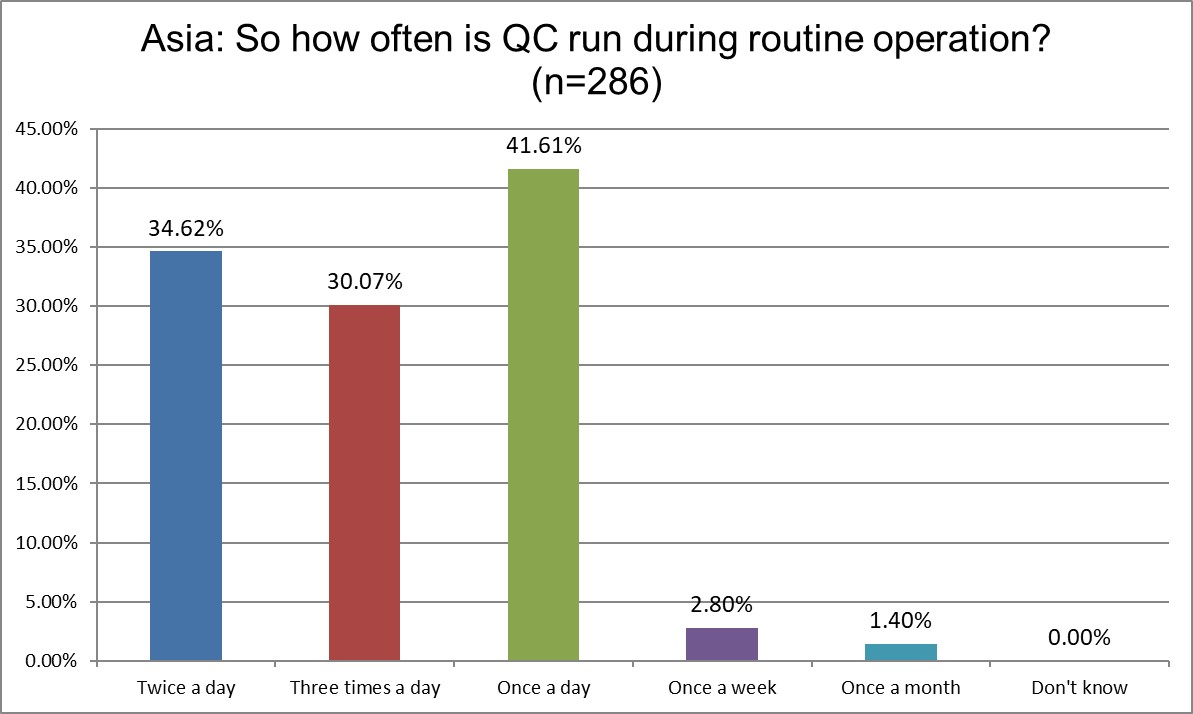
Running three times a day QC significantly increased from 11% in 2021 to 30% in 2025. Running QC once a day declined from 54% down to 41%. Running QC 2x a day is essentially unchanged. As more labs run more tests, operate more hours and more shifts, more QC must be run.
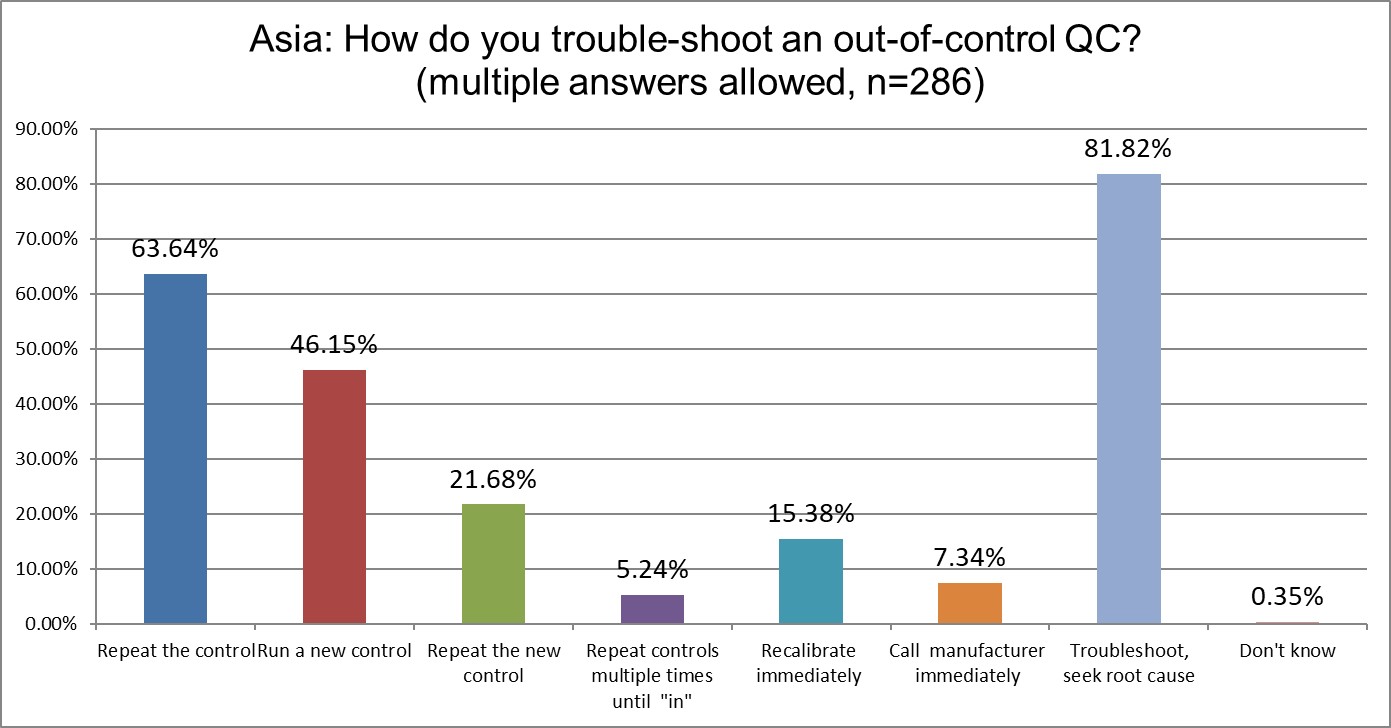
But if running QC is going up, so will the number of out of control events. Here we see a small increase in the first response of repeating the control (was 58% in 2021, now 63% in 2025). The running of a new control and the repeating of that control have stayed about the same. The % of labs that keep repeating and repeating until they get the result to fall "in" decreased from 9% in 2021 to 5% in 2025. Their is a decline in the number of recalibrations from 20% in 2021 down to 15% in 2025. The number of labs that troubleshoot and seek root cause has also increased from 78% in 2021 up to nearly 82% in 2025. Asia is repeating the control at lower rates than the US.
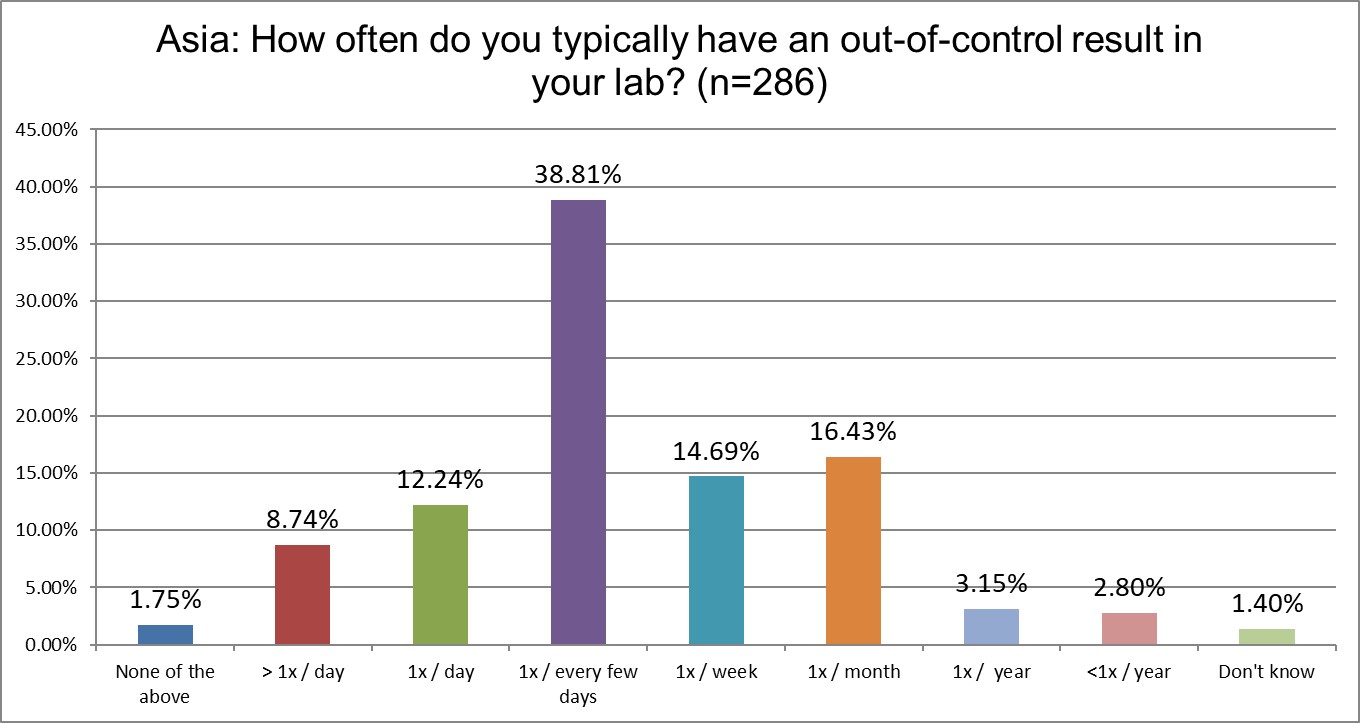
Asian labs report being out of control significantly less than Europe and the US. Labs here are out of control every day at less than half the rate reported in the US. Asian labs are also significantly less out of control than European labs (1/5 vs 1/3, roughly).
Nevertheless, being out of control daily has increased in Asia. In 2021, 15% of labs said they were ooc once a day or more than once a day. Now that's nearly 22% in 2025. In 2021, about 28% of labs said they were ooc every few days. Now that's 38%.
More oocs are occurring in Asian labs than ever before, but they are still seeing fewer oocs than Europe or the US. The big question: are these oocs simply false rejections, or are more errors actually happening?
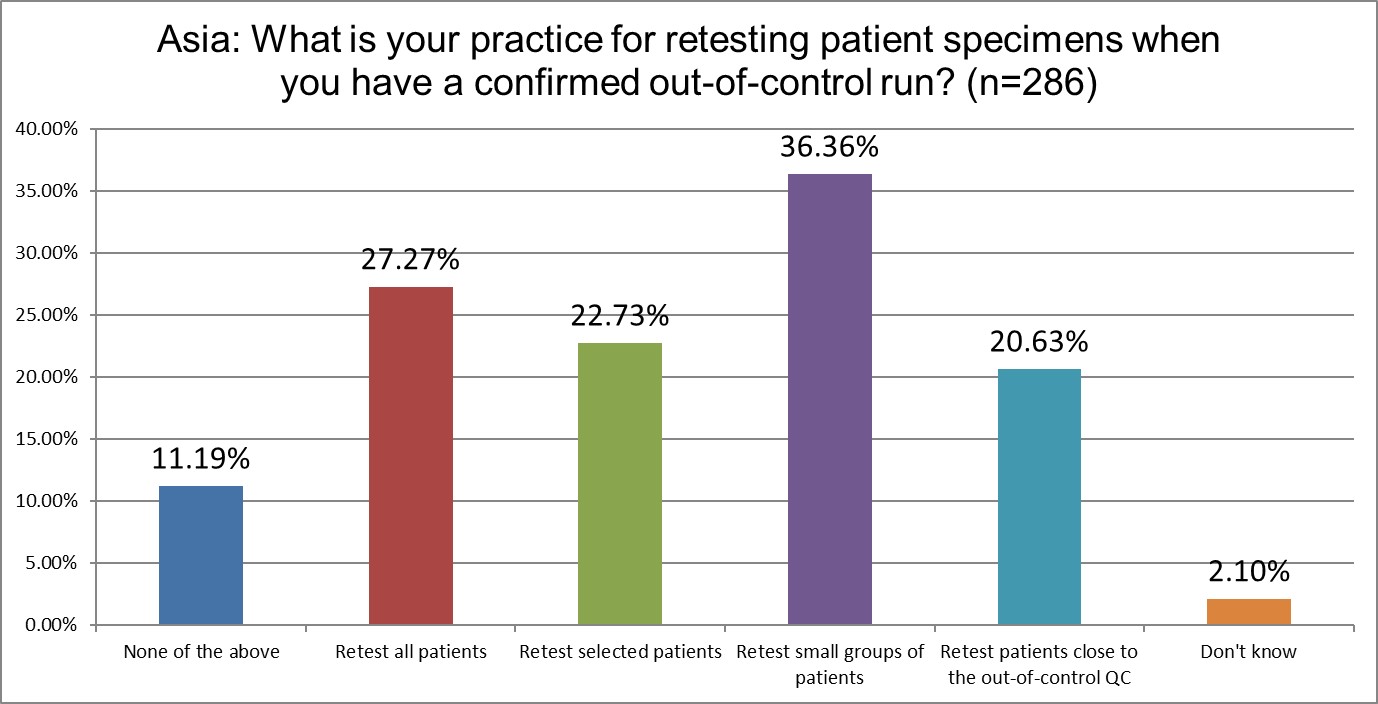
The percentage of Asian labs that retest all patients after an out-of-control episode remains steady. Retesting select groups of patients sequentially has decline from 32% in 2021 down to about 22% in 2025. Retesting patients close to the ooc control level increased from 12% in 2021 up to 20% in 2025.
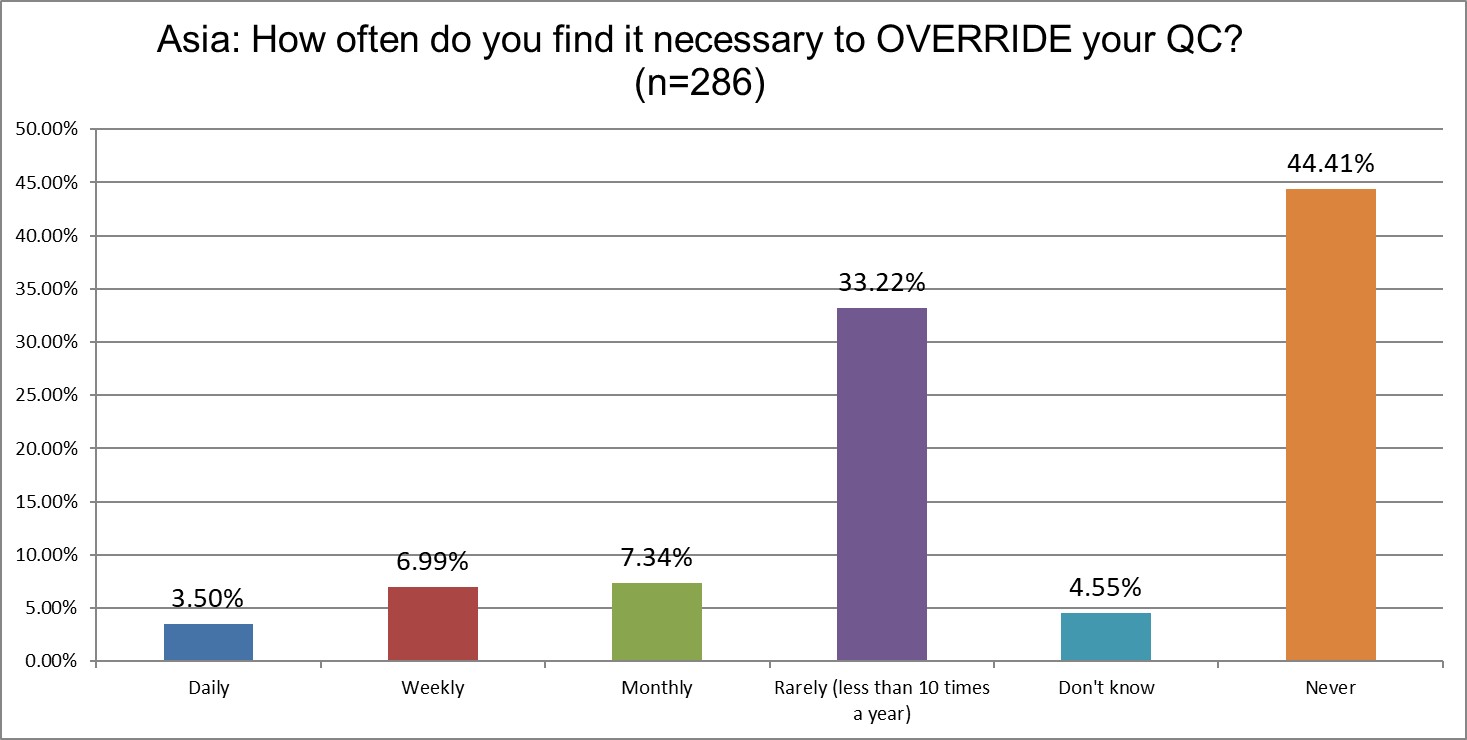
The good news is that the number of labs that send out test results even when there's an out of control run has declined. In 2021, over 15% of labs said they did this on a regular basis (daily and weekly). In 2025, that's now just over 10%. The number of labs that say they never override their QC rose from 36% in 2021 up to 44% in 2025.
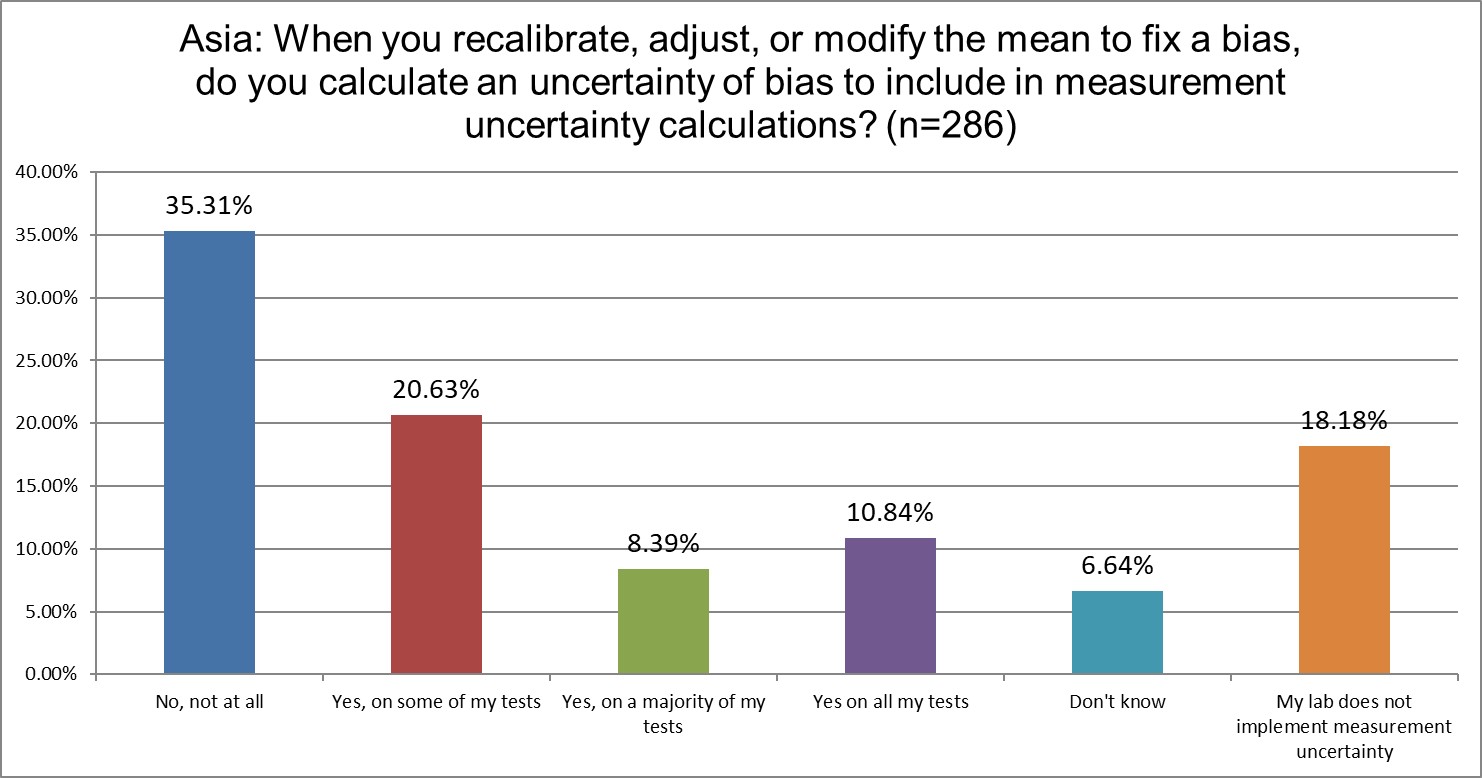
This question about bias uncertainty, or more correctly put, the measurement uncertainty around the correction of bias, is a new one to the 2025 survey. The cutting edge of measurement ucnertainty is how to incorporate bias into the overall uncertainty. !8% of labs in Asia say they do not calculate mu, and 35% of them do not involve bias in their mu calculations. Only about 11% of Asia labs state they account for bias in their mu. Asia accounts for mu far more than the US, but still significantly less than Europe.
The Final Overview
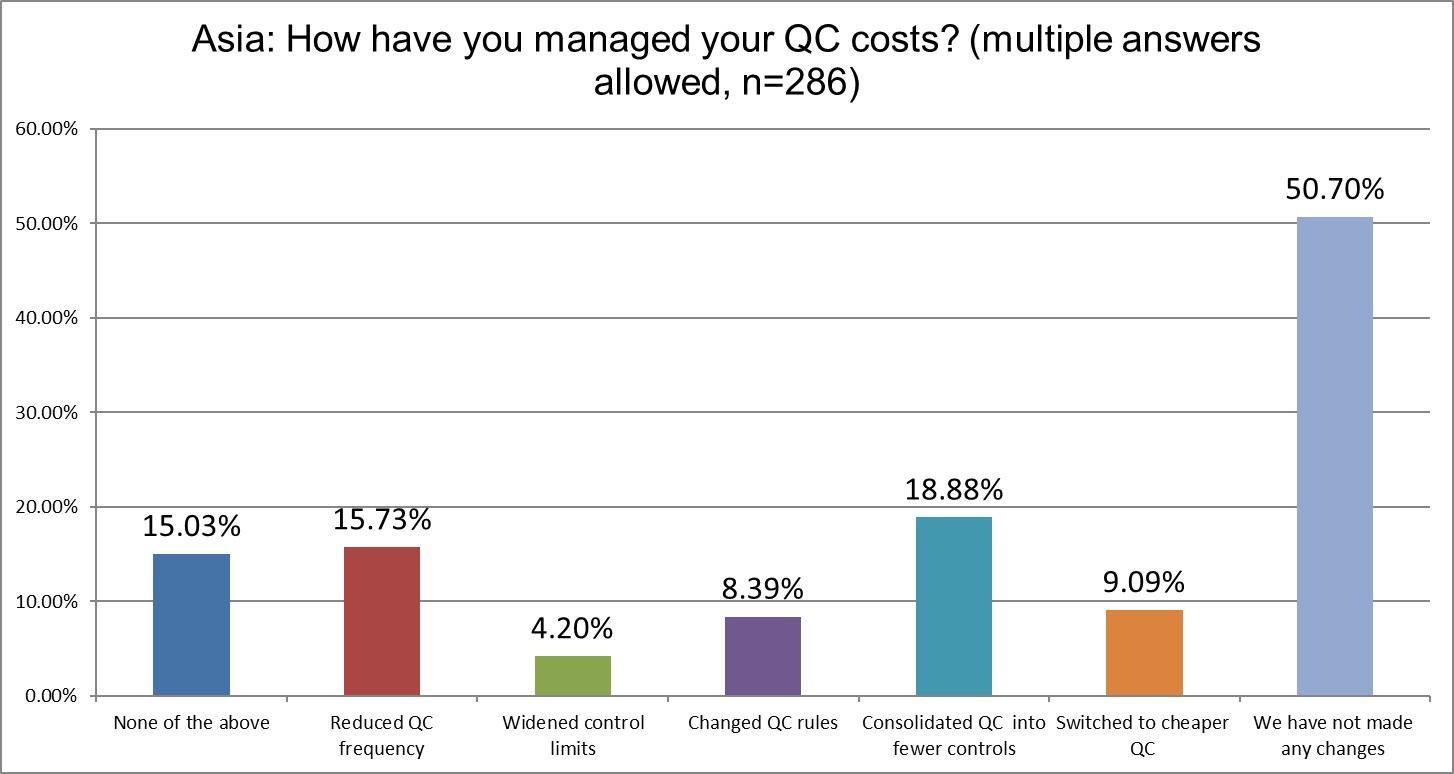
More labs have addressed their QC costs since 2021. In our previous survey, 63.5% of Asia labs said they hadn't done anything. In 2025, it's now down to 50%, a significant decrease. But what they've done is all over the map. In 2021, 22.9% were reducing QC frequency; now that's only 15.7% in 2025. In 2021, about 9.5% widened their limits; now that's only 4.2% in 2025. In 2021, 18.9% of labs changed their rules; now that's just about 8.4% in 2025. In 2021, about 14.9% consolidated their QC into fewer controls; now that's 18.9%, one of the few actions that increased. The other step that increased from 2021 to 2025 was switching to cheaper controls, rising from about 6.7% to about 9.1%. Asia is certainly a region where there are new entrants into the diagnostic and control material vendor space.
In summary, almost half of Asian labs have still done nothing to change how they do QC and how much they spend on it. Or actually, as the other questions revealed, they have increased running QC and repeating controls and responding to repeats with even more repeats. QC is getting more expensive in Asia, too.