Sigma Metric Analysis
Dymind hematology analyzers in Thailand
A recent study looked at the analytical performance of three models of the Dymind hematology analyzer. If this laboratory was in the US, would they be able to meet CLIA 2025 targets?
Hematology on the Dymind DF55, DH76, DH615 in Thailand
December 2025
Sten Westgard, MS
A recent study from the Department of Pathology, Faculty of Medicine, Prince of Songkla University in Thailand evaluated the performance of the Dymind DF55, DH76, and DH615.
Performance evaluation of the new Dymind automated hematology analyzer, Penglong T, Tepakhan W, Tehyoh N, Songkhla YN, Songnak C, Srinoun K, Practical Laboratory Medicine 47 (2025) 300507. https://doi.org/10.1016/j.plabm.2025.e00507.
Calculating Sigma metrics from routine laboratory performance data.
The imprecision and bias of the analyzers:
The QC run was from the manufacturer, not ideal but quite common for hematology analyzers. If anything, that means the imprecision estimates here might be optimistic. Imprecision was assessed by following the CLSI guideline EP5-A2, "between-run precision was measured by processing the manufacturer's quality control materials from three different lot numbers (low, normal and high) twice daily for 20 consecutive days." Bias was assessed by performing a comparison of methods study. "CBC parameters were obtained from the Dymind analyzers were compared with results from the Sysmex XN-3000...using 483 samples for DF55 and DH76 and 371 samples for DH615....The correlation coefficients, regression equation, difference, and percentage difference of the CBC parameter comparison were calculated using CLSI EP9-A2." The Passing-Bablock regression was used to calculate bias at the control levels.
The study did not apply any formal performance standards in its assessment. In our application here, we will benchmark performance against CLIA standards, where they exist, as well as ESFEQA for those parameters that CLIA does not directly regulate. Those goals can be found here.
| DF55 Analyte | CV% | Bias% |
| Hemoglobin | 2.0 | 3.4 |
| Hemoglobin | 1.4 | 1.5 |
| Hemoglobin | 4.2 | 1.2 |
| Hematocrit | 2.3 | 1.4 |
| Hematocrit | 1.5 | 1.0 |
| Hematocrit | 2.0 | 0.9 |
| MCV | 1.2 | 0.4 |
| MCV | 0.7 | 0.3 |
| MCV | 0.6 | 0.3 |
| Platelets | 4.7 | 8.8 |
| Platelets | 2.1 | 3.0 |
| Platelets | 2.8 | 2.1 |
| RBC | 1.7 | 6.4 |
| RBC | 1.3 | 0.7 |
| RBC | 1.5 | 0.0 |
| WBC | 2.4 | 0.4 |
| WBC | 2.4 | 1.8 |
| WBC | 2.0 | 2.5 |
| Lymphocytes | 3.2 | 114.5 |
| Lymphocytes | 3.0 | 65.6 |
| Lymphocytes | 2.8 | 42.4 |
| Monocytes | 6.7 | 563.0 |
| Monocytes | 5.3 | 211.9 |
| Monocytes | 5.2 | 72.7 |
| Eosinophils | 4.5 | 45.5 |
| Eosinophils | 5.6 | 14.1 |
| Eosinophils | 3.8 | 4.8 |
| Neutrophils | 3.2 | 6.9 |
| Neutrophils | 3.0 | 3.2 |
| Neutrophils | 2.6 | 1.9 |
DH76
| DH76 Analyte | CV% | Bias% |
| Hemoglobin | 2.0 | 3.4 |
| Hemoglobin | 1.0 | 1.5 |
| Hemoglobin | 4.2 | 1.2 |
| Hematocrit | 2.3 | 2.9 |
| Hematocrit | 1.1 | 1.9 |
| Hematocrit | 1.6 | 1.7 |
| MCV | 0.9 | 12.4 |
| MCV | 0.7 | 11.4 |
| MCV | 0.6 | 10.8 |
| Platelets | 5.2 | 7.9 |
| Platelets | 2.7 | 1.4 |
| Platelets | 2.8 | 2.7 |
| RBC | 1.7 | 2.9 |
| RBC | 1.1 | 0.1 |
| RBC | 1.5 | 0.4 |
| WBC | 2.2 | 4.6 |
| WBC | 1.9 | 2.5 |
| WBC | 1.7 | 1.7 |
| Lymphocytes | 4.1 | 138.9 |
| Lymphocytes | 2.7 | 80.9 |
| Lymphocytes | 3.4 | 52.6 |
| Monocytes | 4.8 | 17.6 |
| Monocytes | 5.9 | 0.8 |
| Monocytes | 4.9 | 6.1 |
| Eosinophils | 6.3 | 17.8 |
| Eosinophils | 5.7 | 4.7 |
| Eosinophils | 5.3 | 1.0 |
| Neutrophils | 4.0 | 42.3 |
| Neutrophils | 3.1 | 14.2 |
| Neutrophils | 2.2 | 4.2 |
DH615
| DH615 Analyte | CV% | Bias% |
| Hemoglobin | 2.0 | 2.5 |
| Hemoglobin | 0.6 | 2.8 |
| Hemoglobin | 0.6 | 2.8 |
| Hematocrit | 2.3 | 15.3 |
| Hematocrit | 2.0 | 9.3 |
| Hematocrit | 2.1 | 8.1 |
| MCV | 1.6 | 0.4 |
| MCV | 1.7 | 0.6 |
| MCV | 32.7 | 0.7 |
| Platelets | 4.2 | 16.4 |
| Platelets | 3.2 | 1.5 |
| Platelets | 2.2 | 4.6 |
| RBC | 1.7 | 6.1 |
| RBC | 0.9 | 3.7 |
| RBC | 0.9 | 3.2 |
| WBC | 1.7 | 7.1 |
| WBC | 1.3 | 5.6 |
| WBC | 1.0 | 4.6 |
| Lymphocytes | 4.6 | 21.5 |
| Lymphocytes | 2.2 | 6.3 |
| Lymphocytes | 1.3 | 2.7 |
| Monocytes | 5.7 | 53.1 |
| Monocytes | 6.0 | 30.0 |
| Monocytes | 4.5 | 6.3 |
| Eosinophils | 3.7 | 37.0 |
| Eosinophils | 7.7 | 25.6 |
| Eosinophils | 3.2 | 7.9 |
| Neutrophils | 2.4 | 49.7 |
| Neutrophils | 1.7 | 30.5 |
| Neutrophils | 1.2 | 9.1 |
Even a casual glance at these tables reveals some significant biases between the Dymind methods and the Sysmex XN-3000 methods.
From this we can calculated the analytical Sigma-metric. What we'll do here is present that data visually.
Graphic Display of performance by Normalized Method Decision Chart (NMEDx)
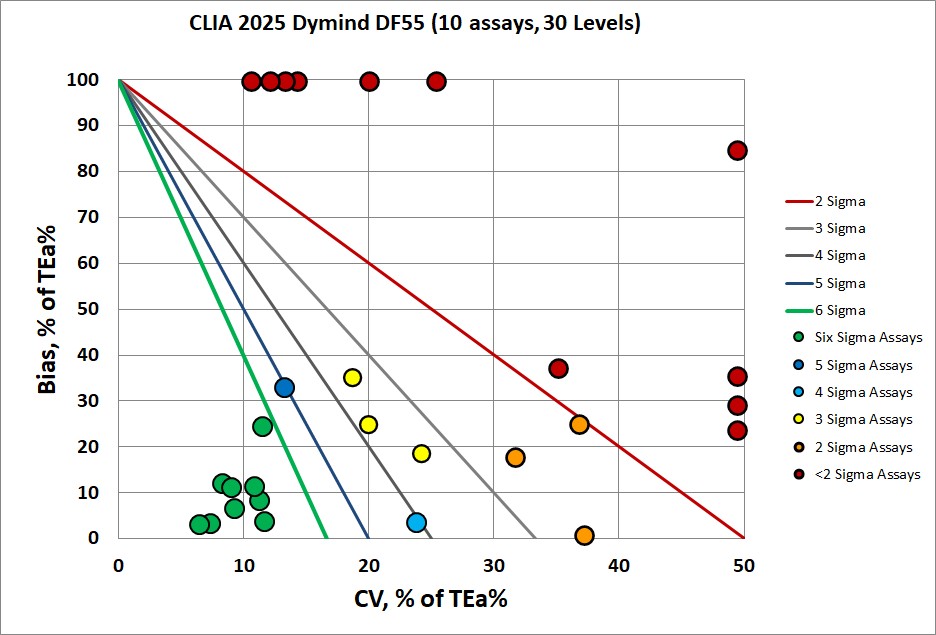
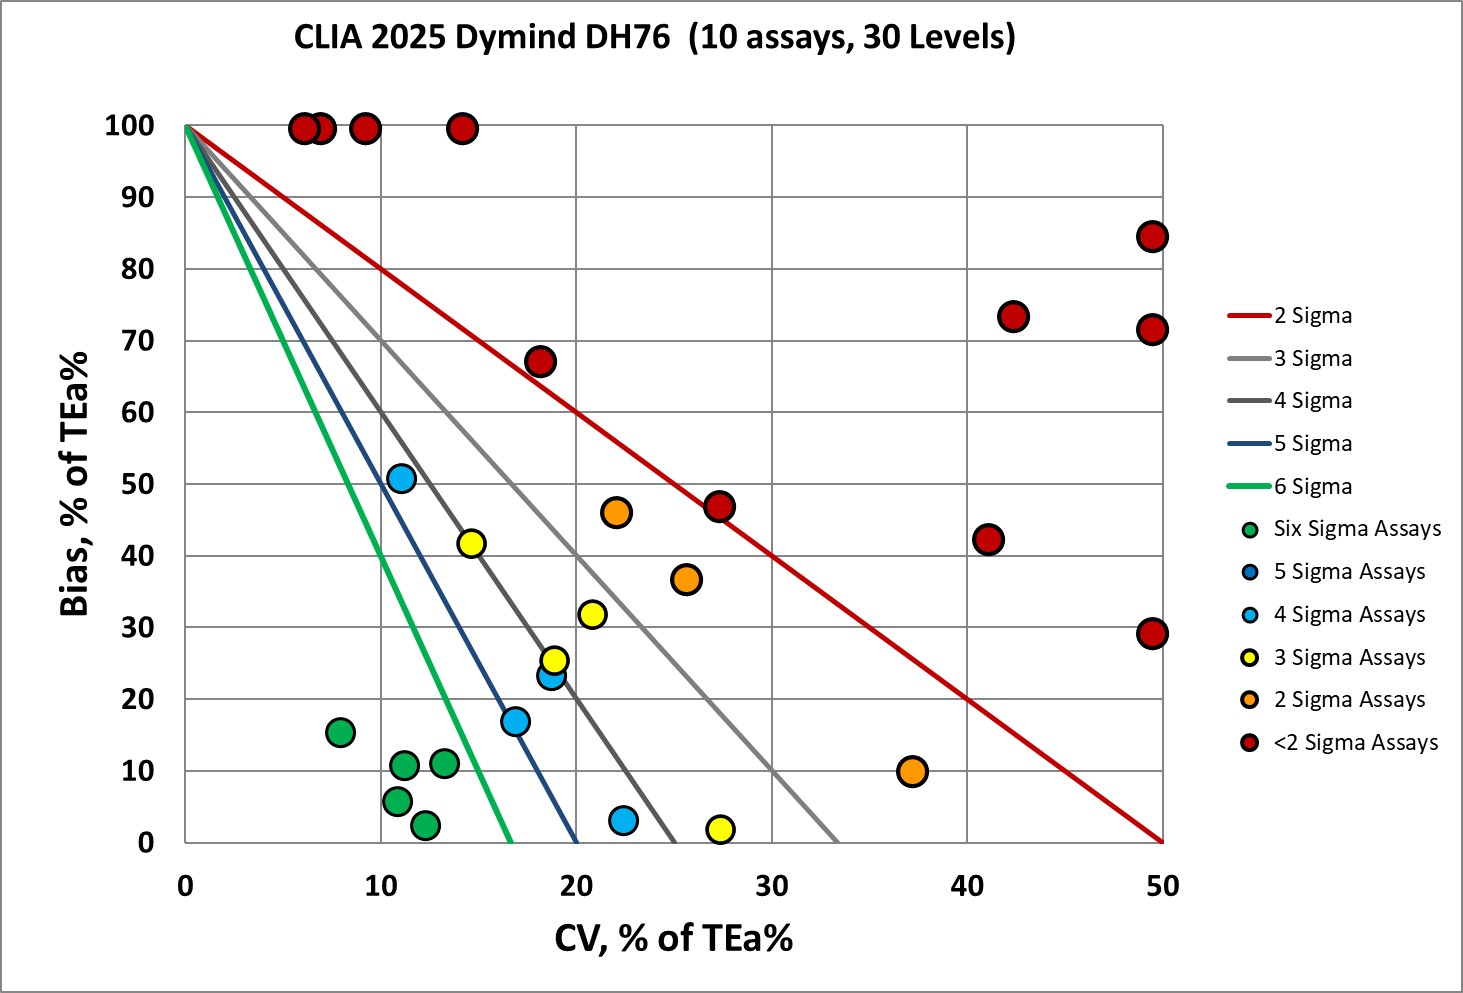
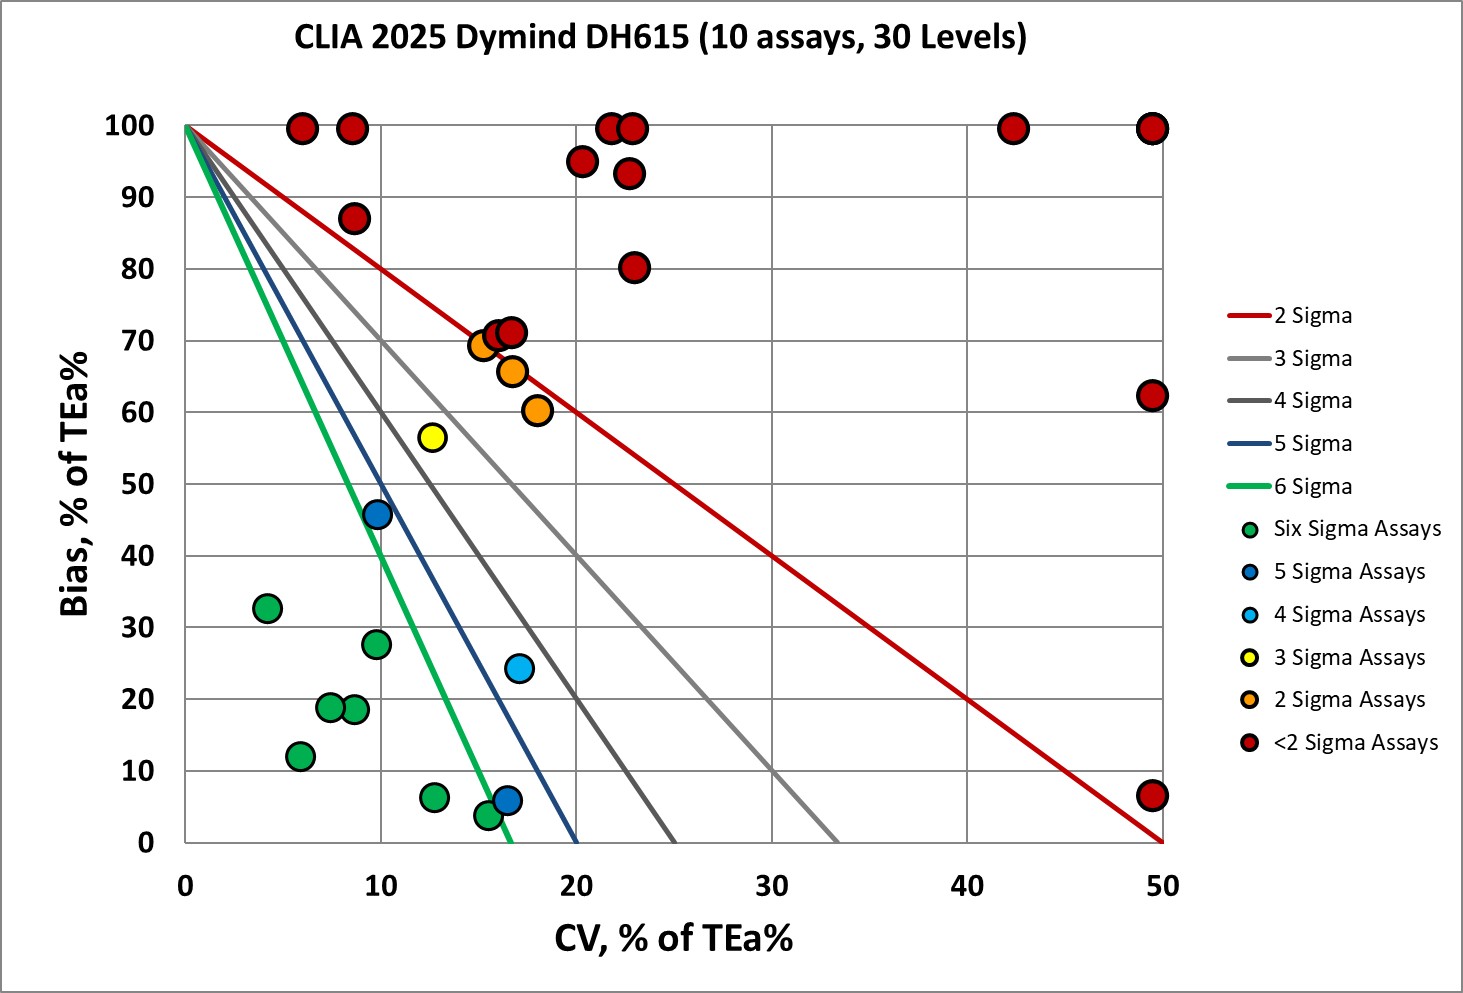
For all three of these analyzers, a majority of performance is below 2 Sigma.
Even if we decided to discount the bias measured between the Dymind and the Sysmex methods, there are still significant imprecision problems.
Conclusion
We see once again that the hematology goals for CLIA 2025 are significantly harder to hit, no matter where in the world you are. While this lab is located in Thailand, and thus is not subject to the CLIA regulations, this kind of performance would generate problematic issues for the laboratory if it was here in the US..