Sigma Metric Analysis
A Roche Cobas c301 in Dubai
A recent study looked at the analytical performance of a Roche cobas c301 in Dubai. Unfortunately, a few mistakes were made in the published version of the calculations. We correct them here.
A Roche Cobas c301 in Dubai
April 2026
Sten Westgard, MS
[Sigma quality score: +1 for bias comparison through EQA program; +0.5 for bias calculated from commutable material.+ 0.5 control levels measured near critical decision levels. +0.5 imprecision measured under intermediate precision conditions. Final score: 2.5 = Optimistic.]
A recent study from the Nad al Hammar Health Centre of Dubai Health in Dubai looked at the analytical performance and Sigma metrics of the clinical chemistry module of the Roche Cobas c301 analyzer:
Mohammad Imteyaz Ahmad, Fayha Salah Ahmed, Deepa Rao, Mohamedi Begum, Sheifa Joan. A comparative study of sigma metrics and statistical quality control rules in clinical biochemistry laboratories using a Cobas pure analyzer. J Family Med Prim Care February 2026;15:774-82.
Calculating Sigma metrics from routine laboratory performance data.
The imprecision and bias of the analyzers:
Imprecision was calculated from the manufacturer controls with mean and SD calculated from 6 months of performance. Bias was determined from the "general chemistry external QC program of the College of American Pathologists (CAP)." There were two levels of controls and only one measured level of bias, so the bias gets used twice in these calculations. Analytical sigma-metrics were calculated using the standard Sigma equation.
Unfortunately, the study had some problems in calculations. The figures published in table 2 contain significant errors. The calculations in the table below are the correct ones.
| Analyte | CV% | Bias% | Sigma |
| Albumin | 2.22 | 2.2 | 2.6 |
| Albumin | 1.24 | 2.2 | 4.7 |
| Alk Phos | 3.85 | 1.4 | 4.8 |
| Alk Phos | 2.32 | 1.4 | 8.0 |
| ALT | 2.28 | 0 | 6.6 |
| ALT | 2.17 | 0 | 6.9 |
| Amylase | 0.98 | 0.7 | 19.7 |
| Amylase | 0.87 | 0.7 | 22.2 |
| AST | 1.92 | 3.8 | 5.8 |
| AST | 1.14 | 3.8 | 9.8 |
| Bilirubin, Total | 3.36 | 1.7 | 5.4 |
| Bilirubin, Total | 2.93 | 1.7 | 6.2 |
| Calcium | 0.8 | 0.9 | 4.9 |
| Calcium | 0.68 | 0.9 | 5.7 |
| Chloride | 0.88 | 1.3 | 4.2 |
| Chloride | 1.1 | 1.3 | 3.4 |
| Cholesterol | 1.27 | 1 | 7.1 |
| Cholesterol | 1.26 | 1 | 7.1 |
| CO2 | 1.58 | 4 | 10.1 |
| CO2 | 1.19 | 4 | 13.4 |
| Creatinine | 1.4 | 1.6 | 6.0 |
| Creatinine | 0.85 | 1.6 | 9.9 |
| GGT | 1 | 1.9 | 13.1 |
| GGT | 1.63 | 1.9 | 8.0 |
| Glucose | 0.74 | 1.1 | 9.3 |
| Glucose | 0.74 | 1.1 | 9.3 |
| HbA1c | 1.6 | 1.7 | 3.9 |
| HbA1c | 1.39 | 1.7 | 4.5 |
| HDL | 1.43 | 1.1 | 13.2 |
| HDL | 1.34 | 1.1 | 14.1 |
| Iron | 0.95 | 2.8 | 12.8 |
| Iron | 0.84 | 2.8 | 14.5 |
| LDL | 1.62 | 2.5 | 10.8 |
| LDL | 1.61 | 2.5 | 10.9 |
| Magnesium | 1.41 | 1.5 | 9.6 |
| Magnesium | 0.77 | 1.5 | 17.5 |
| Phosphorous | 1 | 2.5 | 7.5 |
| Phosphorous | 0.66 | 2.5 | 11.4 |
| Potassium | 1.27 | 1.1 | 2.0 |
| Potassium | 0.88 | 1.1 | 2.8 |
| Protein, Total | 0.82 | 1.5 | 7.9 |
| Protein, Total | 0.68 | 1.5 | 9.6 |
| Sodium | 0.93 | 0.5 | 3.3 |
| Sodium | 0.77 | 1.1 | 3.2 |
| Triglycerides | 0.97 | 1 | 14.4 |
| Triglycerides | 0.77 | 1 | 18.2 |
| Urea Nitrogen | 2.24 | 1.2 | 3.5 |
| Urea Nitrogen | 1.93 | 1.2 | 4.0 |
| Uric Acid | 0.7 | 3.2 | 9.7 |
| Uric Acid | 1.11 | 3.2 | 6.1 |
Graphic Display of performance by Normalized Method Decision Chart (NMEDx)
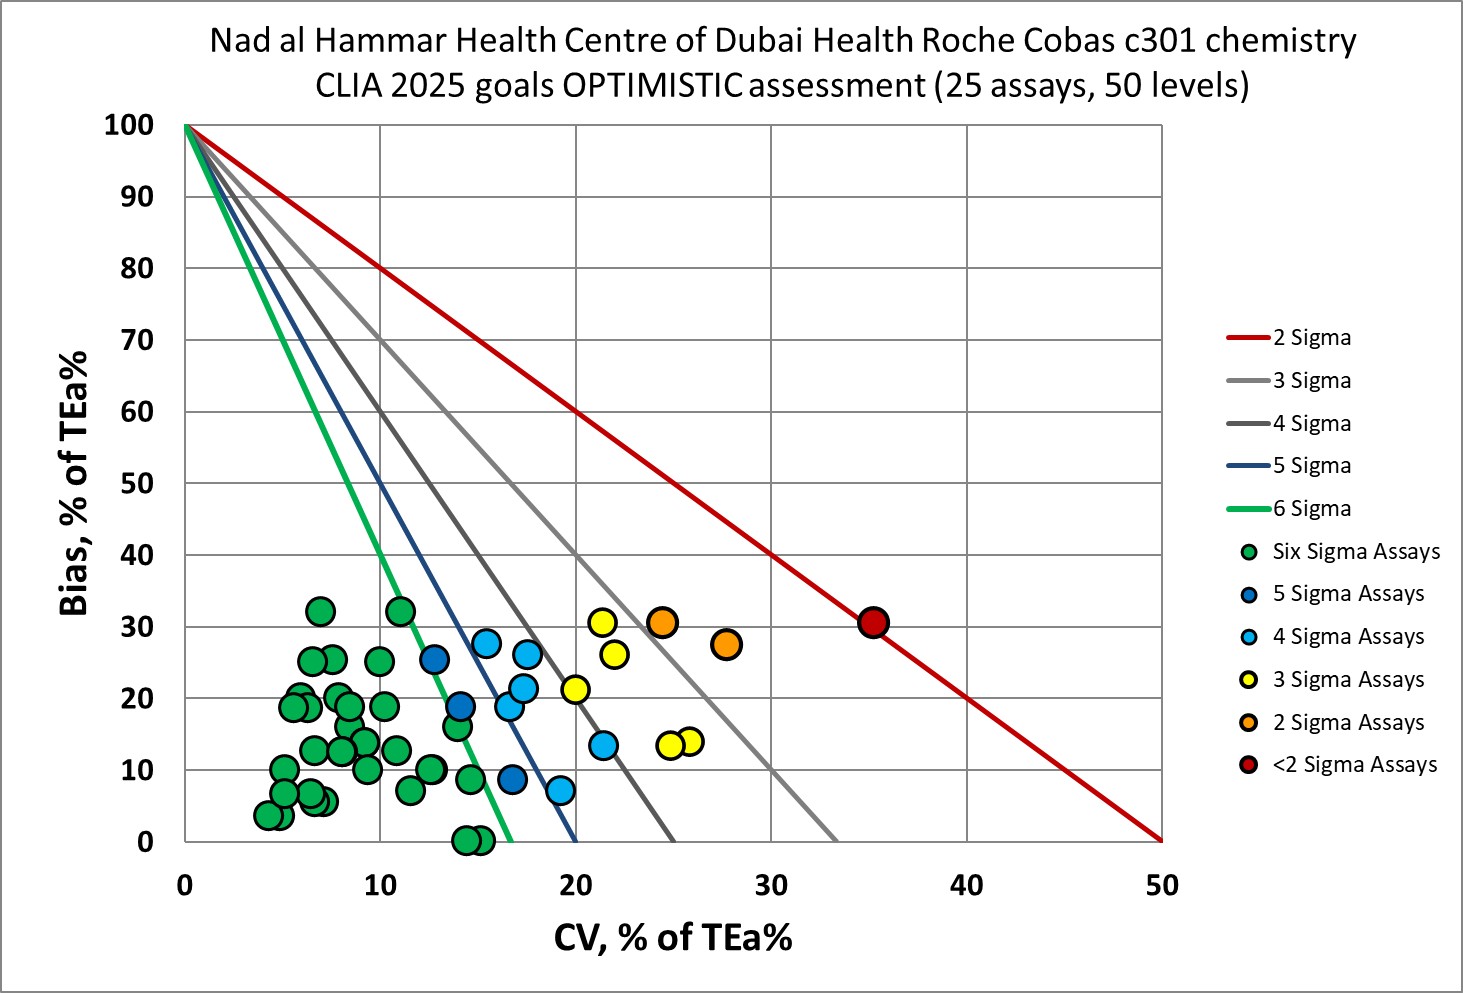
Given the conditions of the data collection, it's not entirely surprising to see that the analytical metrics are quite good. Manufacturer controls are almost, by design, going to give the best picture of performance. If this assessment had been done under longer term circumstances, with 3rd party controls, we would be far happier.
Conclusion
Despite some of the errors in the study, the corrected figures are quite optimistic. Can these be trusted, that's another issue entirely. A better assessment of performance would involve 3rd party controls.