Basic QC Practices
Break all the Rules! (Part Two)
We continue our series on basic QC interpretation. Part 1 was easy - just 1 control. Now what happens when we have 2 controls? How do we interpret across materials/levels? Does that mean we stop interpreting across runs? Here's another simple exercise - if you're told that all the rules have been broken, can you find where the violations occurred?
Break All the Rules! (Part Two)
Sten Westgard, MS
October 2015
As laboratorians, we are constantly pressured to achieve compliance, to operate with an absence of problems, to generate a stream of data points that land lovingly near the mean. As a contrarian exercise, this article is about the exact opposite of getting all your data to stay in control. We're going to look at data that's out-of-control, breaking all of the various "Westgard Rules." And we're going to see if you can identify which data points are outliers and which rules are being broken.
As the title suggests, this is second installment. Part One was just one control. Now we're going to get more complicated and complex and closer to reality. We're going to look at rule violations with two controls.
The data
The following data set is going to have a low control with a mean of 47 and an SD of 3 and a high control with a mean of 71 and an SD of 8. I'm not going to tell you which test or what units are involved. They're irrelevant to this exercise. We're also not going to look at the total allowable error or CV or bias. All of that becomes important after we know the basics of QC and charting.
Control Measurement |
Value 1
|
Z-value 1
|
Value 2 |
Z-value 2 |
Rule Broken |
| 1 | 51.5 | 82.2 | |||
| 2 | 38.9 | 51 | |||
| 3 | 47.6 | 74.2 | |||
| 4 | 46.0 | 91.8 | |||
| 5 | 50.9 | 74.2 | |||
| 6 | 53.9 | 69.0 | |||
| 7 | 52.7 | 58.2 | |||
| 8 | 49.1 | 95.5 | |||
| 9 | 48.5 | 65.4 | |||
| 10 | 37.0 | 90.0 | |||
| 11 | 47.0 | 63.0 | |||
| 12 | 54.0 | 82.2 | |||
| 13 | 53.3 | 65.4 | |||
| 14 | 40.0 | 86.2 | |||
| 15 | 55.4 | 70.2 | |||
| 16 | 49.4 | 88.6 | |||
| 17 | 46.7 | 87.8 | |||
| 18 | 45.8 | 85.0 | |||
| 19 | 52.7 | 76.6 | |||
| 20 | 51.1 | 65.4 | |||
| 21 | 54.0 | 86.2 | |||
| 22 | 53.0 | 71.0 | |||
| 23 | 49.7 | 81.4 | |||
| 24 | 48.2 | 90.2 | |||
| 25 | 46.4 | 80.6 | |||
| 26 | 54.2 | 54.0 | |||
| 27 | 51.2 | 53 | |||
| 28 | 53.9 | 76.6 | |||
| 29 | 44.3 | 72.6 | |||
| 30 | 48.5 | 84.6 |
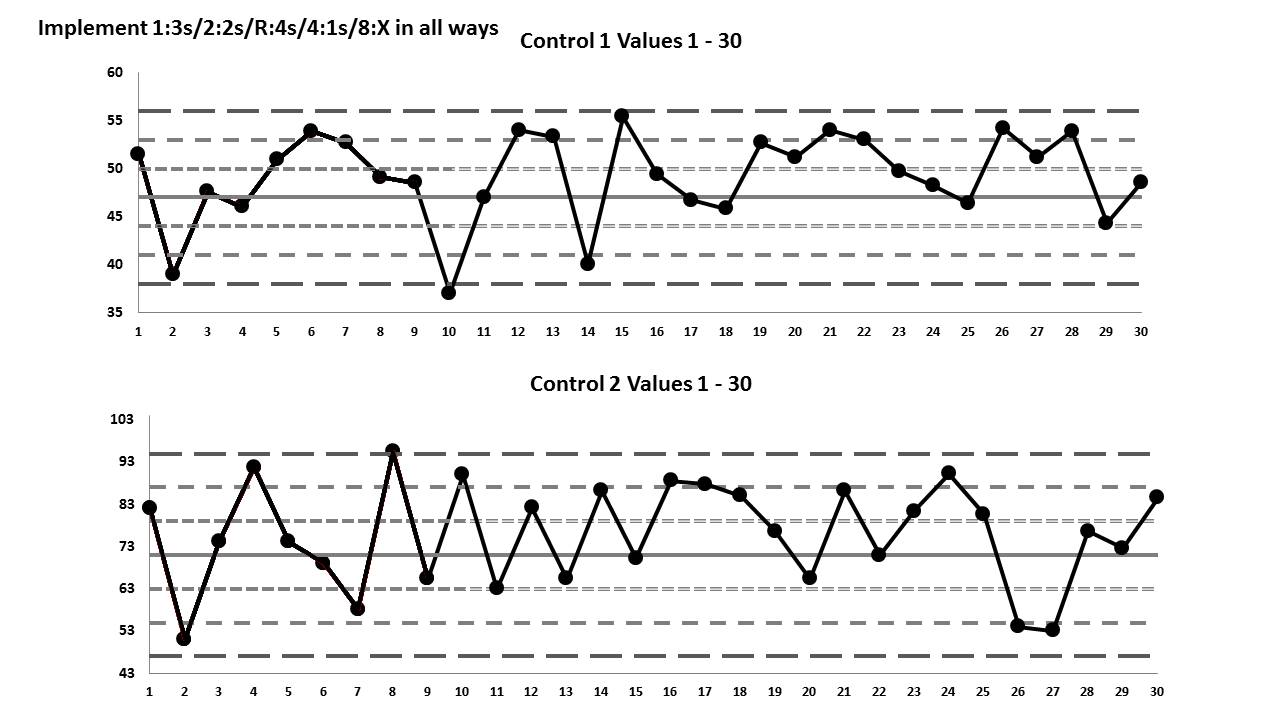
To make it a little easier to understand this data, here are the Levey-Jennings charts for these first 30 values:
Control Measurement |
Value 1
|
Z-value 1
|
Value 2 |
Z-value 2 |
Rule Broken |
| 31 | 48.5 | 85.4 | |||
| 32 | 48.8 | 86.2 | |||
| 33 | 46.7 | 80.0 | |||
| 34 | 46.1 | 79.9 | |||
| 35 | 46.0 | 83.8 | |||
| 36 | 53.9 | 68.0 | |||
| 37 | 43.0 | 64.6 | |||
| 38 | 42.0 | 71.0 | |||
| 39 | 40.0 | 83.0 | |||
| 40 | 42.5 | 67.0 | |||
| 41 | 50.3 | 74.2 | |||
| 42 | 44.3 | 46.0 | |||
| 43 | 51.8 | 71.8 | |||
| 44 | 41.9 | 59.8 | |||
| 45 | 40.0 | 57.0 | |||
| 46 | 48.8 | 86.2 | |||
| 47 | 53.0 | 55.0 | |||
| 48 | 52.4 | 70.0 | |||
| 49 | 38.0 | 79.0 | |||
| 50 | 49.1 | 70.0 | |||
| 51 | 44.0 | 69.0 | |||
| 52 | 48.8 | 75.0 | |||
| 53 | 50.6 | 76.6 | |||
| 54 | 43.7 | 72.6 | |||
| 55 | 47.6 | 80.0 | |||
| 56 | 45.5 | 79.0 | |||
| 57 | 44.3 | 74.0 | |||
| 58 | 52.4 | 82.0 | |||
| 59 | 53.9 | 72.0 | |||
| 60 | 45.2 | 60.6 |
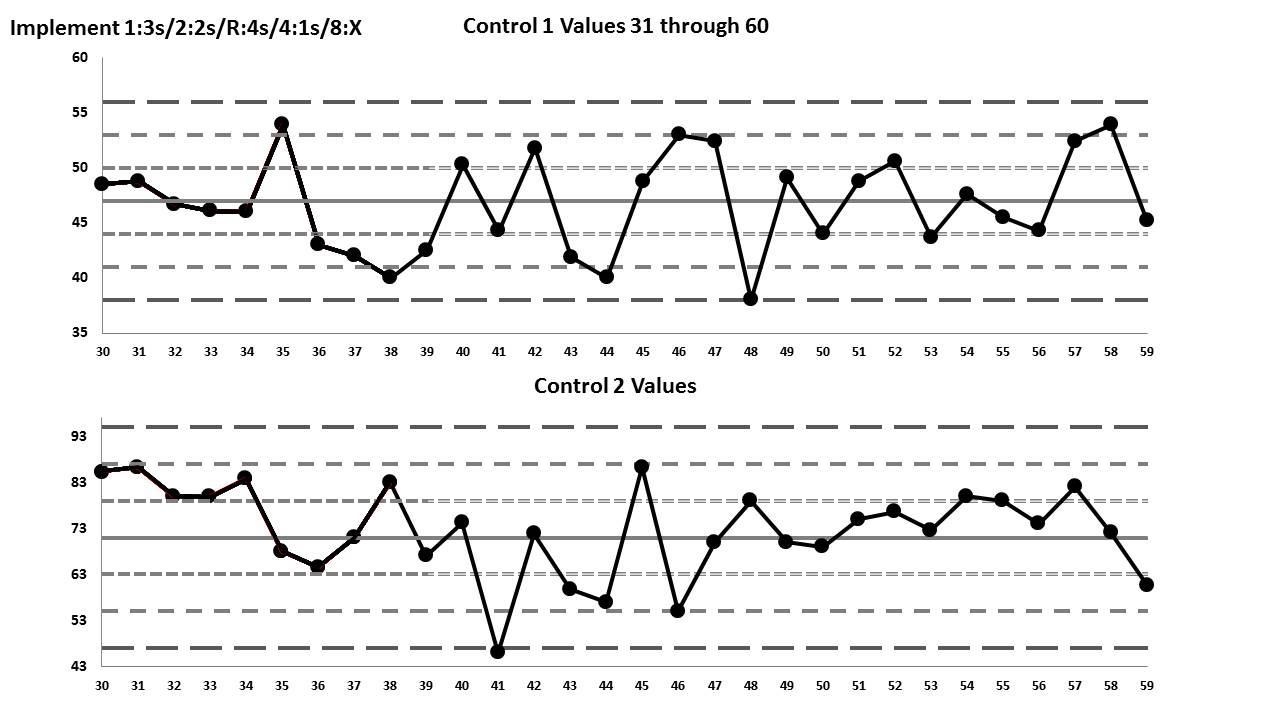
Here is the second set of Levey-Jennings charts for values 31 through 60:
Control Measurement |
Value 1
|
Z-value 1
|
Value 2 |
Z-value 2 |
Rule Broken |
| 61 | 45.8 | 74.2 | |||
| 62 | 50.6 | 64.6 | |||
| 63 | 48.0 | 71.0 | |||
| 64 | 49.0 | 83.0 | |||
| 65 | 51.0 | 67.0 | |||
| 66 | 53.0 | 74.2 | |||
| 67 | 48.0 | 80.6 | |||
| 68 | 49.0 | 71.8 | |||
| 69 | 50.0 | 69.4 | |||
| 70 | 47.8 | 81.4 | |||
| 71 | 45.5 | 65.4 | |||
| 72 | 46.0 | 70.0 | |||
| 73 | 45.0 | 69.0 | |||
| 74 | 46.0 | 66.0 | |||
| 75 | 47.9 | 68.6 | |||
| 76 | 48.5 | 86.2 | |||
| 77 | 50.9 | 59.8 | |||
| 78 | 46.7 | 67.8 | |||
| 79 | 47.8 | 86.2 | |||
| 80 | 50.3 | 72.6 | |||
| 81 | 52.0 | 81.4 | |||
| 82 | 52.0 | 74.2 | |||
| 83 | 48.5 | 80.6 | |||
| 84 | 44.3 | 79.8 | |||
| 85 | 49.4 | 75.0 | |||
| 86 | 46.7 | 76.6 | |||
| 87 | 52.7 | 72.6 | |||
| 88 | 45.2 | 55.8 | |||
| 89 | 48.8 | 79.0 | |||
| 90 | 46.4 | 70.2 | |||
| 91 | 49.7 | 82.2 |
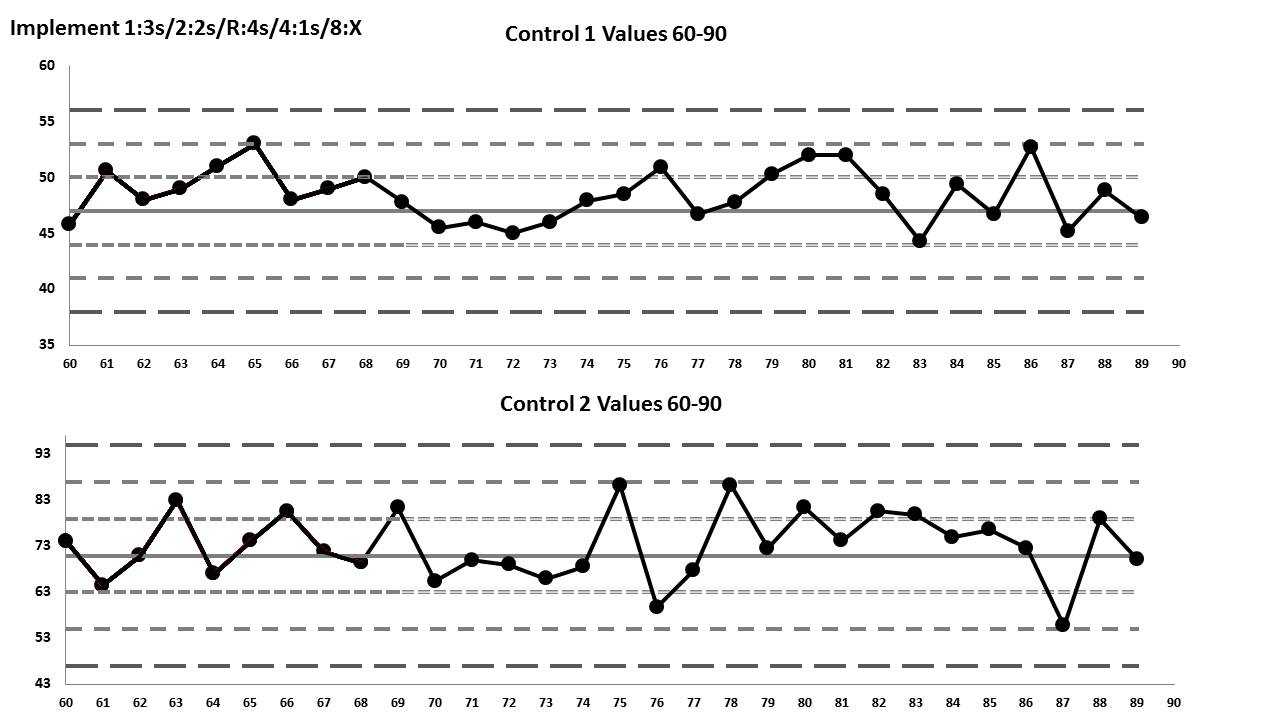
Finally, here is the third set of Levey-Jennings charts for the values 61 through 90:
Now, in addition to this data, I'm going to add the following conditions:
- We are running TWO controls per run; assume each pair of valuea represents one run
- We're NOT going to look for 2s violations. Let's break that habit right now. In any case, I didn't generate these data points randomly, so we should not expect to see a certain number "natural false rejections" in the form of 2s outliers
- We ARE going to try to find outliers of the following "Westgard Rules": 1:3s/2:2s/R:4s/4:1s/8:x
- We're NOT going to sink into the swamp that is the repeating of controls. So don't assume anything you see is a repeated control - just stick with "in" or "out"
So, at the end of this, can you answer the following questions?
- How many rule violations were there?
- Which rules were violated and how many times?
- What would be different if I told you that only the "Westgard Rules" 1:3s/2:2s/R:4s were necessary?
- What would be different if I told you that only the 1:3s control rule was necessary?
- What's the extra little error that exists in these charts and data points?
These answers, and more, next month...
[Don't feel like you have to submit this exercise for grading. But perhaps you can share this with your colleagues and see if you can reach the same conclusions and interpretations.]