Basic QC Practices
QC - The Chances of Rejection
Dr. Westgard explains how an analytical testing process works to reject the bad runs and keep the good runs. False rejection and error detection are explained. The different kinds of problems (precision , accuracy, etc.) are also described. If you've ever wondered whether there was method to your laboratory madness, this article is for you.
- QC error alarm
- QC rejection characteristics
- Expected behavior of different control rules
- Known rejection characteristics
- What to do?
- How do you select QC procedures with appropriate rejection characteristics?
- References
NOTE: An updated version of this article is now available in Basic QC Practices, 2nd Edition
The room or building you're in most likely has a fire alarm or a whole system of fire detectors. What's the chance that a fire will detected by your alarm system if the source of the fire is:
- one match?
- a whole matchbook?
- a wastebasket?
- your whole desk?
We all want to believe that the alarm system would do its job and we would get out safely, but that assumes that the installation was carefully planned. The actual chance of detection depends on how many detectors were installed, where those detectors are located, and how sensitive the detectors are. If there were a serious fire (i.e. your desk), you would like to be certain that it will be detected before it got out-of-control, i.e., you want a 100% chance of detection or true alarms. On the other hand, as long as there isn't a serious fire (i.e. one match), you don't want the alarm to go off and interrupt what you're doing, so you want a 0% chance of false alarms.
QC error alarm
The fire we want to detect in an analytical testing process is any analytical error that would burn a physician or patient, i.e., destroy the value of the test result that we are providing to the physician or patient. Like a fire detector, a QC procedure is an analytical error detector that sounds an alarm when something happens to the analytical testing process or "method.". The alarm is supposed to detect situations of unstable method performance with 100% certainty (or probability of 1.00), and ideally, shouldn't give any false alarms (0.00% chance or probability of 0.00) when performance is stable or the method is working okay. You would expect that the chance of detecting an analytical problem will depend on the size of the error occurring, the number of controls used to monitor method performance, and the sensitivity of the statistical rules being applied. You want a high chance or probability of detecting medically important errors, but you don't want to be interrupted by false alarms when the method is working okay.
QC rejection characteristics
No detector is perfect! Undoubtedly you have experienced a fire alarm when there wasn't any fire. You may also have heard of situations where a fire got started and was already out-of-control before it was detected. The same things can happen with the control systems that are used to monitor the performance of laboratory tests. That's why it's critical to select appropriate control rules and an appropriate number of control measurements. The QC procedure must be carefully planned to assure that medically important errors will be detected and the quality of our work - reported test results - will be acceptable. We also need to minimize the false alarms to improve the efficiency and productivity of our work.
The terms that describe the performance of any detector are the frequency of true alarms and frequency of false alarms; for QC procedures, these characteristics are called the probability for error detection and the probability for false rejection, resp.
- Probability for error detection, Ped, is the probability of rejecting an analytical run having an error occurring in addition to the stable imprecision of the measurement procedure. Ideally, Ped should be 1.00, which means there would be a 100% chance of detecting an error. A practical design objective is a Ped of 0.90, which means there would be a 90% chance of detecting an analytical problem.
- Probability for false rejection, Pfr, is the probability of rejecting an analytical run when there is no error except for the stable imprecision of the measurement procedure. Ideally, Pfr should be 0.00 to provide a 0.00% chance of false rejection. In practice, a practical design objective is a Pfr of 0.05 or less, which means there would be only a 5% or less chance of false rejection.
The stable imprecision of the measurement is the random variation observed when the same patient or control materials is analyzed repeatedly, such as in the replication experiment that is part of the initial evaluation studies performed on a method.
Expected behavior of different QC rules
Don't get scared off by these "probability" terms. What you need to learn about QC procedures is that each combination of rules and N has a certain chance of detecting changes in method performance and a certain chance of giving a false rejection signal even when method performance is okay. Those false rejections can be minimized by avoiding certain control rules and Ns that have a high rate of false rejections. Error detection can be maximized by selecting sensitive single-rule procedures, constructing multirule combinations, and obtaining an appropriate number of control measurements.
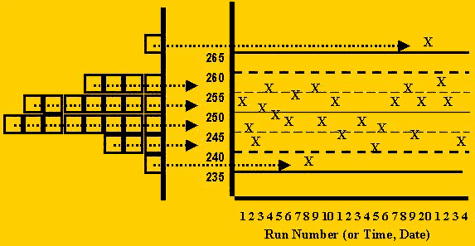 Different control rules are expected to behave differently, or have different sensitivities, for different types of errors. To understand this behavior, review the "idea" of QC in the first figure to see how the error distribution is reflected in the control chart. Observe that the center of the distribution agrees with the center of the control chart. Notice that the ends or tails of the distribution correspond to certain control limits and that it would be unusual to see control measurements in these tails, therefore, such control observations often indicate there is a problem with the method.
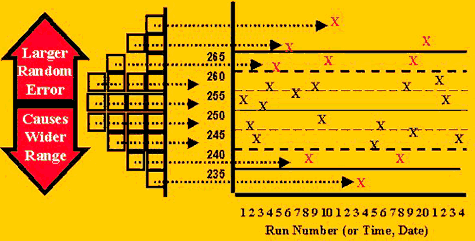
The distribution of points on a control chart would be expected to change with changes in the accuracy (systematic error) and precision (random error). Two cases of interest are:
- An accuracy problem, or increase in systematic error, would changes the mean of the histogram, therefore shifting all the control values in one direction, higher or lower.
- A precision problem, or increase in random error, would cause the standard deviation to increase, therefore widening the expected distribution of control values, causing some values to be higher and some to be lower.
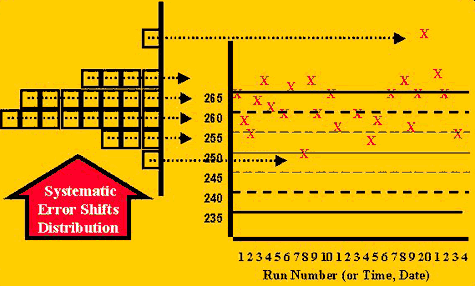 The accuracy problem, or situation for detecting systematic error, can be illustrated by the change shown in the second figure. In this case, more of the control values are expected to fall on one side of the mean and to exceed any control limits set on that side of the mean. The closer a control limit is to the mean, e.g. 2s vs. 3s limits, the more measurements are expected to exceed the limit. Of course, during stable performance, there is also a high chance of observing individual measurements outside control limits that are close to the mean. One way to separate the cases of stable and unstable performance is to look for consecutive measurements on one side of a limit, such as 2 in a row exceeding a 2s limit (22s rule), 3 or 4 in a row exceeding a 1s limit (31s and 41s rules, resp.), and 6, 8, 9, 10, or 12 in a row falling on on side of the mean (6x, 8x, 9x, 10x, and 12x rules, resp.).
The precision problem, or situation for detecting an increase in random error, is quite different because the width of the distribution expands, which in turn causes measurements to exceed both the high and low control limits, as shown in the third figure. The rules for detecting random error look for individual observations exceeding a fairly wide limit, such as 3s or 2.5s (13s or 12.5s rules, resp.), or for the range or difference between the high and low values of a group of control measurements to exceed a wide limit such as 4s (R4s rule). This R4s rule can be implemented as a qualitative "counting" type of range rule by identifying one control measurement exceeding a +2s limit and another exceeding a -2s limit; this is the form of the range rule that is usually used in multirule type QC procedures that also implement a series of counting rules for detecting systematic errors. A quantitative "calculation" type of range rule can be implemented by taking the actual difference between the high and low values, for example, for values +1.5, +2.3, -0.8, and -1.8, the range would be 4.1 (difference between +2.3 and -1.8).
Known Rejection characteristics
The rejection probabilities of QC procedures can be determined by computer simulation studies that construct data sets incorporating known types and amounts of analytical errors, then evaluate whether or not those known errors are detected by different statistical control rules. Computer simulation studies were performed over 20 years ago to document the expected rejection characteristics of commonly used control rules [1].
False rejection characteristics
Let's deal with false alarms or false rejections first. From your own experience with fire alarms, you know that once you have responded to a false alarm, you will be cautious about responding to the next alarm, whether its true or false. It's important to minimize the false rejections so that everyone will do the right thing when the alarm goes off. The right response is to stop what we're doing and get out of the building until the fire is put out. Likewise, with laboratory QC, the right response is to stop the analytical process and move the specimens to a safe location until the problem is put out.
False rejection problem with 12s control rule! The biggest problem with false alarms is with the 12s control rule (i.e. the Levey-Jennings control chart with control limits set as the mean plus and minus 2 standard deviations). With N=1, it's about 5%, which corresponds to that area in the tails of the distribution that exceed the mean plus and minus 2s. That's the "1 out of 20" that most of us learned about in basic QC. What isn't as well understood is that as N increases, the false rejections also increase, becoming about 9% with N=2, 14% with N=3, and 18% with N=4. That means if you are analyzing two controls per run, you should expect that 1 out of 10 runs will be falsely rejected, rather than 1 out of 20. That would be a 10% waste test production, which certainly wouldn't be tolerated in any other production operation. Therefore, you should not generally use the 12s control rule with Ns or 2 and higher.
The false rejections are suitably low for other common laboratory QC procedures with Ns from 2 to 4, e.g. 1% or less for the 13s and 13.5s rules, and 5% or less for 12.5s and multirule QC procedures with Ns up to 4. As N gets higher, the R4s rule gives too many false rejections and should therefore be changed to a quantitative range rule -- control limits of approximately 5s to maintain a 1% false rejection from the range rule when there are 6 to 8 control measurements per run.
Error detection characteristics
Unfortunately, as control limits widen and false rejections are reduced, the error detection also goes down. The rules that are most sensitive for detecting systematic error are the 22s, 2of32s, 31s, 41s, 6x and 8x; the rules most sensitive for random error are the 13s, 12.5s, and R4s rules. Single rule procedures with 13s and 12.5s and Ns from 2 to 4 are often sufficiently sensitive for monitoring test performance on today's high precision automated systems. Multirule procedures using 13s, 22s or 2of32s, R4s, 31s or 41s rules, and 6x or 8x rules may be necessary for earlier generation instruments and manual methods.
More quantitative information about the rejection characteristics of QC procedures can be provided by power function graphs [2], which describe the probability for rejection as a function of the system of error occurring. Separate graphs can be provided to describe the detection of systematic and random errors. See the earlier lesson on power function graphs for more detailed information.
Summary of rejection characteristics
The accompanying table summarizes the responses of different control rules to different error conditions, identifies one rule to be avoided (12s), and identifies which other rules are most sensitive for detection or random or systematic errors.
| Error Condition | High Pfr | High Ped |
|
|
12s | |
|
|
12.5s, 13s, 13.5s R4s, R0.05, R0.01 |
|
|
|
22s, 41s, 2of32s, 31s 6x, 8x, 9x, 10x, 12x x0.05, x0.01 cusum |
Approach for improving QC performance
Based on the expected responses of different control rules, as summarized in the table above, a general strategy for selecting a QC procedure would be as follows:
- Eliminate those control rules that have a high probability of false rejection.
- Select a combination of rules having at least one rule responsive to random error and one to systematic error.
- Assess the probabilities of rejection for that combination of rules.
- Choose the total number of control measurements (N) to provide the desired probability of error detection.
A more quantitative QC planning process is possible when the laboratory defines the quality required by the test, determines the imprecision and inaccuracy available from the method, and considers the specific power curves for the control rules and Ns of interest.
What to do?
You need to understand the performance characteristics of both your method and QC procedure to properly manage an analytical testing process. This includes not only the imprecision and inaccuracy characteristics of the method but also the rejection characteristics of the QC procedure. You want to avoid false rejections because they waste time and money, which generally means avoiding 2s control limits! You also want to be sure you have the necessary error detection to assure the analytical quality required for your physicians and patients, which may require using other control rules, such as 12.5s or 13s/22s/R4s/41s, and a larger number of control measurements to give the desired error detection.
The maximum QC procedures (i.e., maximum error detection with tolerable false rejection levels, 6-8%) that are practical to implement are probably the 12.5s single-rule with N=6 and the 13s/22s/R4s/31s/6x multi-rules with N=6. If these procedures aren't sufficient to control your methods, you need better methods. If you don't want to go to these maximum QC procedures, you need even better methods!
How do you select QC procedures with appropriate rejection characteristics?
You need to implement a QC planning process that supports your selection of control rules and numbers of control measurements based on the quality required for the test, the observed imprecision and inaccuracy of your method, and the expected rejection characteristics of the candidate QC procedures that are practical for your laboratory. See QC - The Planning Process for a brief description of four available approaches. See also Mapping the road to analytical quality with charts of operating specifications for an overview of one of the most powerful planning tools - the OPSpecs chart.
References
- Westgard JO, Groth T, Aronsson T, Falk H, deVerdier C-H. Performance characteristics of rules for internal quality control: Probabilities for false rejection and error detection. Clin Chem 1977;23:1857-67.
- Westgard JO, Groth T. Power functions for statistical control rules. Clin Chem 1979;25:863-69.