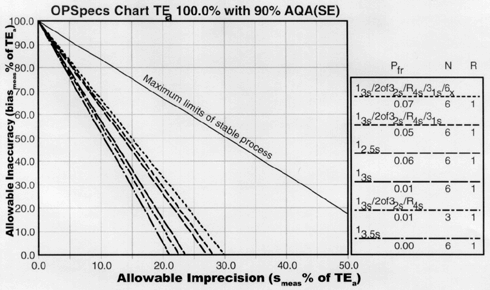
Normalized OPSpecs Chart, N=6, 90% AQA
A Normalized OPSpecs charts displaying QC procedures with Ns of 6, 90% AQA.

Use the Normalized OPSpecs Calculator provided to calculate your normalized operating point.
See the Normalized OPSpecs Chart Lesson for more information.
try the Normalized OPSpecs Chart for 50% error detection with N's of 3.
