Basic Planning for Quality
QP-8: Implementing a manual process using Normalized OPSpecs charts
So you don't have the resources for fancy computers and networks and such to plan your quality. What would you say if you only one graph to plan your quality? A "Normalized" OPSpecs chart allows you to choose control rules for any laboratory method. Learn how to use them. You can even download them and use them now. (Preview)
- Concept of a normalized OPSpecs chart
- Step-by-step procedure
- Normalized charts for 2 and 3 control materials
- Example Applications
- Try it!
- References
You can start a manual quality-planning process now -- using the normalized OPSPecs charts presented in this lesson. This use of normalized OPSpecs charts requires some additional calculations, but allows you to get by with just a handful of charts for all your applications. The one important limitation is that these normalized charts work only for the allowable total error type of requirement, such as given by the CLIA acceptability criteria in proficiency testing surveys. However, this type of quality requirement is the essential starting point for quality-planning applications in US laboratories.
Concept of a normalized OPSpecs chart
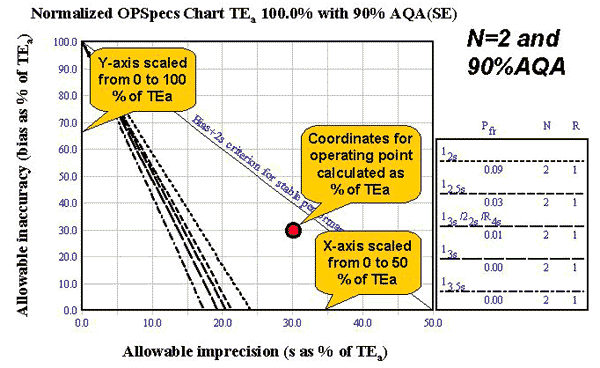
When OPSpecs charts are prepared for different quality requirements, all that really changes are the scales on the X and Y axes. The y-axis is scaled from 0 to TEa and the x-axis is scaled from 0 to 0.5*TEa. The actual operating limits for different QC procedures occupy the same positions relative to the axes, i.e., the charts look exactly the same except for the scaling of the axes.
The idea for a normalized OPSpecs chart[1] is to make the scaling be the same, i.e., the y-scale becomes 0 to 100% TEa and the x-scale becomes 0 to 50% TEa. The operating point will then have to be expressed as a percent of TEa. For example, TEa was 10% for cholesterol in an earlier application, the method CV was 3.0%, and method bias was 3%. The normalized OPSpecs chart is shown here, with the operating point located at 30% of TEa on the y-axis and 30% of TEa on the x-axis, i.e, the original 3% figures are now expressed as 30% of TEa [(3/10)*100 which is 30%]. Note that the chart looks exactly the same as in the earlier lesson that illustrated quality requirements and operating specifications for cholesterol (OPSpecs for TEa=10% with 90% AQA(SE) for N=2 QC procedures).
 We invite you to read the rest of this article
Note: This material is covered in the Basic Planning for Quality manual, which is availalbe in our online store. You can download the Table of Contents and additional chapters here.
Updated and expanded coverage of these topics can be found in Assuring the Right Quality Right,also available in our online store. You can also download the Table of Contents and additional chapters here.
Finally, you can access materials online on these topics by enrolling in the Management and Design of Analytical Quality Systems course course.
Step-by-step procedure
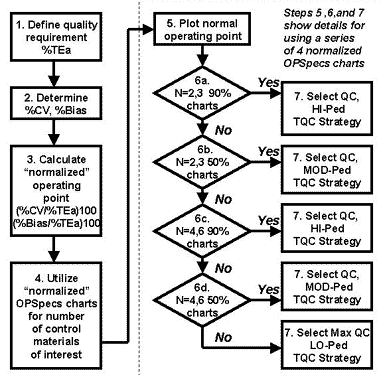 These steps follow the general procedure described earlier in lesson 3, but with adaptations to use normalized OPSpecs charts.
- Define the quality requirement for the test in the form of an allowable total error (TEa), such as given by CLIA proficiency testing criteria.
- Determine the imprecision (CV) and inaccuracy (bias) of the method. Present these estimates in units of percent, i.e., %CV and %bias relative to a medical decision concentration of interest.
- Calculate the normalized operating point by dividing the method %CV or %bias by the defined TEa, multiplying by 100 to express as percent of TEa.
X-coordinate: method CV in percent divided by defined TEa in percent, then multipled by 100, e.g., 3% CV divided by 10% TEa multiplied by 100 gives 30%;
Y-coordinate: method bias in percent divided by defined TEa in percent, ratio then multiplied by 100 to express as percent, e.g., 2% bias divided by 10% TEa, multiplied by 100 gives 20%. - Use normalized OPSpecs charts for the number of control materials of interest in the application, i.e., for two control materials, use the charts for Ns of 2 and 4; for three control materials, use the charts for Ns of 3 and 6.
- Plot the normalized operating point:
- Inspect OPSpecs Charts in the following order and select a QC procedure whose operating limits are above the operating point.
- First, try the low N chart with 90% AQA.
- If no solution can be found on the low N chart and if N cannot be doubled, then try the low N chart with 50% AQA.
- If no solution can be found on the low N and low AQA chart, try doubling N and use the high N chart with 90% AQA.
- If no solution can be found on the high N chart, try the high N chart with 50% AQA.
- If still no solution can be found, then use a maximum QC procedure such as 13s/22s/R4s/41s with N=2, 13s/22s/R4s/41s/8x with N=4 for two control materials; 13s/2of32s/R4s/31s/6x with N=3 or N=6 for three control materials.
- Establish the Total QC strategy on the basis of which OPSpecs chart gives the solution.
- Use HI-Ped TQC when the solution is found on 90% AQA chart;
- Use MOD-Ped TQC when the solution is found on 50% AQA chart;
- Use LO-Ped TQC when no solution is found on the 90% or 50% AQA charts.
- Reassess for changes when appropriate.
For documenting the steps of this process, a worksheet is available in PDF file format and can be downloaded to your computer.
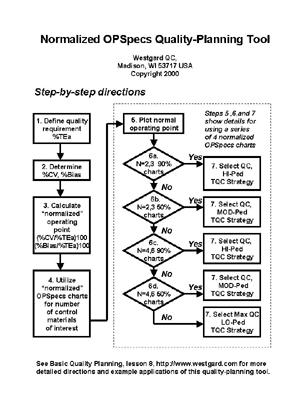
The flowchart shown here describes these same steps. Note that steps 5, 6, and 7 are illustrated in more detail beginning with the box that labeled "plot normalized operating point." These steps involve the sequential use of the series of OPSpecs charts, inspecting the low N 90% AQA OPSpecs chart, assessing whether a QC procedure can be selected, and if not, moving on to the high N 90% AQA OPSpecs chart to repeat the assessment, and if necessary moving on to the high N 50% AQA OPSpecs chart to repeat the assessment for a third time. If no solution is found, then a maximum QC procedure must be defined as the default procedure that is to be implemented. This max QC procedure should represent the most QC that the laboratory can afford to do to monitor method performance. Any method for which the maximum QC procedure is employed should also be targeted for improvement, or even replacement if necessary.
Normalized OPSpecs charts for two and three control materials
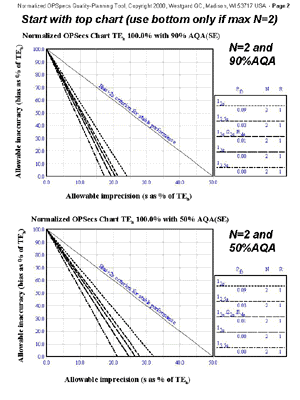
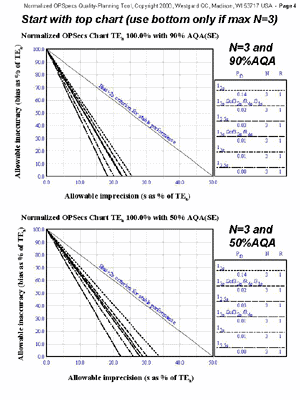
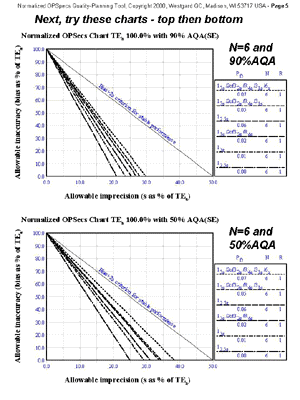
A total of eight normalized OPSpecs charts are needed, four for use with two control materials (N=2 90% AQA, N=4 90% AQA, N=2 50%AQA, N=4 50%AQA) and four for use with three control materials (N=3 90%AQA, N=6 90%AQA, N=3 50%AQA, N=6 50%AQA).You can use a Javascript calcluator for calculating your normalized operating point.
These charts are also available in PDF file format here.
 |
 |
 |
 |
Example applications
Here are three chemistry examples that show how to select QC procedures and TQC strategies using normalized OPSpecs charts. The input parameters describe the quality requirement, observed bias, observed CV, and number of control materials to be assayed. The normalized operating point is then calculated, plotted on the OPSpecs charts, and the chart giving the solution is shown. Using that chart, the QC procedure and TQC strategy are selected.
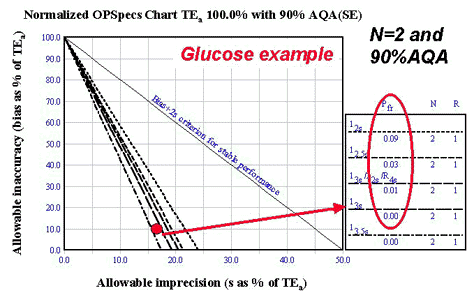
Glucose
- Input parameters: TEa of 6 mg/dL or 10%, whichever greater; observed bias of 1.0 at 120 mg/dL; observed CV of 1.7% at 120 mg/dL; use two control materials.
- Calculated operating point: Y-coordinate is 10% [(1/10)*100]; X-coordinate is 17% [(1.7/10)*100];
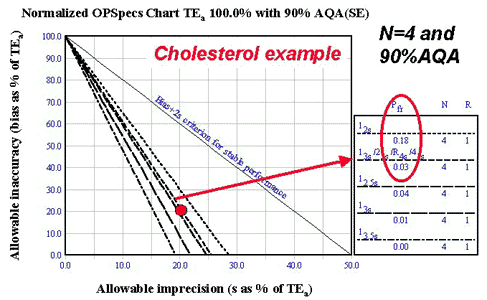
Cholesterol
- Input parameters: TEa 10.0%, observed bias 2.0%, observed CV 2.0%, use two control materials.
- Calculated operating point: Y-coordinate is 20% [(2/10)*100]; X-coordinate is 20% [(2/10)*100]
- Solution found on N=4 90% AQA OPSpecs chart (see chart), which means that each of the two controls should be analyzed twice to give a total N of 4: 13s/22s/R4s/41s with N=4 with provide 90% detection of medically important systematic errors with only 3% false rejections; HI-Ped TQC strategy is appropriate. Avoid 12s with N=4 because of expected 18% false rejections.
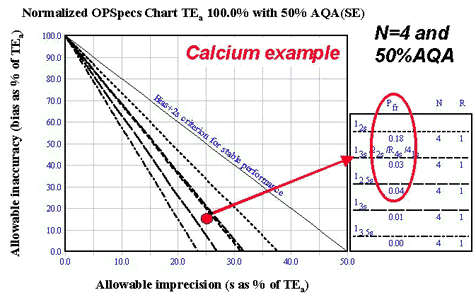
Calcium
- Input parameters: TEa of 1.0 mg/dL or 9.0% at a decision level of 11.0 mg/dL; observed bias of 1.5%; observed imprecision of 2.2%; use two control materials.
- Calculated operating point: Y-coordinate of 17% [(1.5/9.0)*100]; X-coordinate of 24% [(2.2/9.0)*100].
- Solution found on N=4 50% AQA chart (see chart), which means each control material should be analyzed twice to give a total of 4 control measurements per run; 13s/22s/R4s/41s with N=4 will provide somewhat greater than 50% detection of medically important systematic errors with only 3% false rejections; prefer multirule procedure over single rule procedure in this situation and would even be better to add an 8x rule to look-back at control measurements in the previous run; MOD-Ped TQC strategy is appropriate.
Try it!
Here are three more examples for you to try on your own. These examples are for hemoglobin, leukocyte count, and erythrocyte count to demonstrate that this planning process can also be applied to tests in hematology. Look up the quality requirement using the CLIA PT criteria for acceptability. Use three control materials. Select an appropriate QC procedure and TQC strategy.
Hemoglobin
Given an observed bias of 0.0%, an observed imprecision of 1.3%, and three levels of control materials:
- What is the CLIA quality requirement?
- What is the calculated Y-coordinate for the operating point?
- What is the calculated X-coordinate for the operating point?
- Which normalized OPSpecs chart is used for the selection?
- What control rules and N are selected?
- What error detection is expected?
- What false rejection is expected?
- What TQC strategy should be used?
Leukocyte Count
Given an observed bias of 0.0%, observed imprecision of 3.9%, and three levels of control materials:
- What is the CLIA quality requirement?
- What is the calculated Y-coordinate for the operating point?
- What is the calculated X-coordinate for the operating point?
- Which normalized OPSpecs chart is used for the selection?
- What control rules and N are selected?
- What error detection is expected?
- What false rejection is expected?
- What TQC strategy should be used?
Erythrocyte count
Given an observed bias of 0.0%, an observed imprecision of 2.0%, and three levels of control materials:
- What is the CLIA quality requirement?
- What is the calculated Y-coordinate for the operating point?
- What is the calculated X-coordinate for the operating point?
- Which normalized OPSpecs chart is used for the selection?
- What control rules and N are selected?
- What error detection is expected?
- What false rejection is expected?
- What TQC strategy should be used?
Answers for hematology applications
Hemoglobin
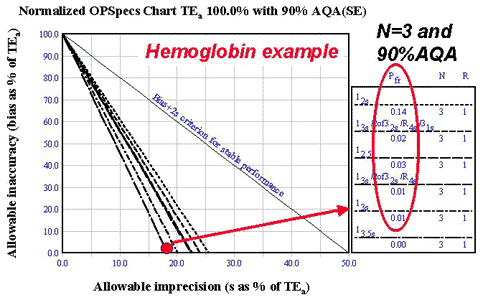
- Input parameters: TEa of 7%; observed bias of 0.0%; observed imprecision of 1.3%; use three control materials.
- Calculated operating point: Y-coordinate is 0.0%; X-coordinate is 18.6% [(1.3/7.0)*100].
- Solution found on N=3 90% AQA OPSpecs chart (see chart): any of 5 different QC procedures are possible, but 13s with N=3 would be the simplest and have the lowest false rejections (0.0%); HI-Ped TQC strategy is appropriate.
Leukocyte Count
- Input parameters: TEa of 15%; observed bias of 0.0%; observed imprecision of 3.9%; use three control materials.
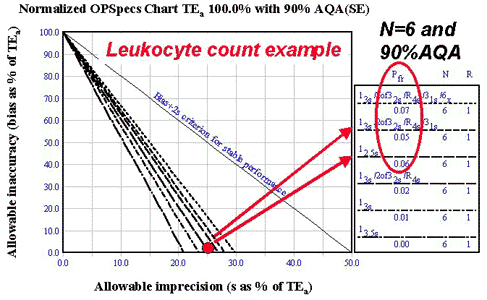
- Calculated operating point: Y-coordinate is 0.0%; X-coordinate is 26% [(3.9/15)*100].
- Solution found on N=6 90% AQA chart (see chart), which means that each of the three controls should be analyzed twice to give the total N of 6; any of top three QC procedure are possible, but would choose between multirule without 6x rule or 12.5s single-rule procedures, which provide 90% error detection with 5-6% false rejections; HI-Ped strategy is appropriate.
Erythrocyte count
- Input parameters: TEa of 6.0%; observed bias of 0.0%; observed imprecision of 2.0%; use three control materials.
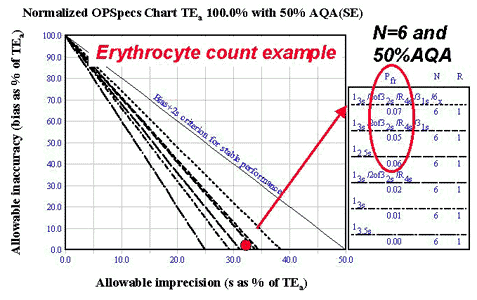
- Calculated operating point: Y-coordinate is 0.0%; X-coordinate is 33.3% [(2/3)*100].
- Solution found on N=6 50% AQA chart (see chart): note that each of the three control materials would have to be analyzed twice to give a total N of 6; the multirule procedure with the most error detection should be used here (includes the 6x rule), even though the false rejection rate is a little bit higher (7% vs 5 or 6% for the other two choices); need to use MOD-Ped TQC strategy here.
REFERENCES
- Westgard JO. Charts of operational process specification ("OPSpecs charts") for assessing the precision, accuracy, and quality control needed to satisfy proficiency testing performance criteria. Clin Chem 1992;38:1226-1233.
