Basic QC Practices
QC - The Multirule Interpretation
Those "Westgard rules" can be confusing. How do you use them? This lesson combines basic QC theory and practice to show you how. Dr. Westgard walks you through a Levey-Jennings chart day by day, plotting the control data and pointing out which run violates which rule. See how the multirule QC should be done (and find out if you've been doing it right yourself).
How to Interpret "Westgard Rules"
- Control rule terminology
- Need to define a QC protocol
- Example control results
- Control rule interpretations
- Issues in using multirule QC procedures
- References
To read the most up to date version of this lesson, we invite you to purchase the Basic QC Practices manual, Fourth Edition, or join the Basic QC Practices online course.
One of our objectives in describing "A multirule Shewhart chart for quality control in clinical chemistry" [1] was to standardize the interpretation of control results. Everyone in the laboratory needs to be able to make the same judgment on whether or not to report patient test results. This may be simple for experienced analysts who can often look at a pattern of control results and quickly come to a valid decision, but new analysts need guidance on what to look for in the control data if the laboratory is to maintain a consistent level of quality. An earlier lesson on Levey-Jennings control charts provided some examples of how to interpret control results when using 2s or 3s control limits. The purpose of this lesson is to illustrate how to interpret results for a multirule QC procedure when two different control materials are being analyzed. Remember that two different QC materials are required according to USA CLIA regulations, thus this lesson is particularly relevant for QC applications in the USA.
Control rule terminology
When we surveyed the industrial quality control literature to identify recommendations for interpreting control results and to study their sensitivity for detecting different kinds of analytical errors [2], we needed some shorthand notation to identify the many recommendations. We introduced abbreviations of the form 13s to identify individual decision criteria or "control rules." Multirule criteria were indicated by putting a "slash" between different control rules, e.g., 13s/22s/R4s/41s/10x. [Review QC - The Westgard Multirules for definitions and illustrations of these individual rules.]
This control rule terminology has now become fairly standard in healthcare laboratories. We think identifying the control rules certainly helps to clarify how control results will be interpreted, but the interpretation does get more complicated when multiple rules are being used, multiple control materials are being analyzed, and control results from multiple runs are being inspected. The key in how to apply control rules with multiple materials and multiple runs is to identify which control results represent consecutive measurements. For example, if one measurement is made on each of two different control materials in an analytical run, control rules can be applied as follows:
- The two control results "within a run" can be inspected by applying a 13s rule to each material, as well as the 22s and R4s rules "across materials."
- The 22s rule can also be applied to the last two measurements "within a material and across runs."
- The 41s rule can be applied to the two control measurements in the current run and the two measurements in the previous run, i.e., the rule can be applied "across materials and across runs".
- The 41s rule can also be applied to the last four measurements "within a material and across runs," which now requires the control results from the three previous runs.
- The 10x rule can be applied to both control measurement in a run for the last five runs, or to the measurements on just one material for the last ten runs.
Need to define a QC protocol
Because of these many possible applications of individual rules in a multirule QC procedure, it is best to provide specific directions for when to analyze controls, how to interpret the results, and what to do based on those results. Here's an example QC protocol that we'll use in this lesson.
- Statistical QC procedure. Use a 12s warning rule and the 13s/22s/R4s/41s/10x rejection rules with 2 control measurements per run.
- Analysis of control materials. Analyze one sample of the Level A control and one sample of the Level B control in each run.
- Interpretation of warning rule. If both control results are within 2s limits, report the patient test results. If one control result exceeds a 2s limit, inspect the control data as follows and reject the run if any control rule is violated
- Within run inspection of control results. Inspect the control results in the current run by applying the 13s rule to the results from each material and the 22s and R4s rules across materials. Note that the 41s and 10x control rules cannot be applied within a run because there are only two control measurements available.
- Across run inspection of control results. Apply the 22s rule within each material across the last two runs; apply the 41s rule within each material across the last 4 runs; apply the 41s rule across the last two runs and the two measurements on each material; apply the 10x rule across the last five runs and the two measurements on each material. [Note that this protocol does not specify applying the 10x rule within each material across the last ten runs.]
- Interpretation of rejection rules. If none of the rules in steps 3 and 4 are violated, accept the run and report patient results. If any one of the rules in steps 3 and 4 is violated, the run is out-of-control; do not report patient test results.
- Problem-solving. When a run is out-of-control, investigate the process and correct the problem, in the following way:
Determine the type of error occurring on the basis of the rule violated. Random error is usually indicated by the 13s or R4srules, whereas systematic error is more likely indicated by the 22s,41s, or 10x rules. Refer to trouble-shooting guides to identify possible causes for the type of error indicated by the control rule that was violated. Inspect the testing process and identify the cause of the problem. Correct the problem, then analyze control samples again to assess control status. Repeat or verify the results on the patient samples once the method has been demonstrated to be in-control. Consult a supervisor for any decision to report patient results when a run is out-of-control.
Example control results for this multirule application
Cholesterol is again used as the example test. The control charts are constructed according to the directions given in the lesson QC - The Levey Jennings Control Chart, where the means and standard deviations of the two control materials are the same as in this example (mean=250 and s=5 for the higher material; mean=200 and s=4 for the lower material). The only difference in constructing the control charts is that the QC protocol here applies the 13s/22s/R4s/41s/10x multirule procedure, therefore the control charts must also have lines drawn at the mean plus 1s and the mean minus 1s, as shown here.
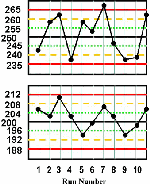 For this lesson, we have purposely plotted the first half of a month's control results on one chart and the second half on another to provide "thumbnail" graphs that are readable. You can click on these thumbnails to get larger pictures, which can also be printed. You may want to print these graphs and work through the example on your own by applying the QC protocol defined above. Then you can identify the out-of-control situations, circle the points for the rule that is violated, and also indicate the type of error that is suggested by the particular rule that is violated. Finally, you cancompare your interpretation to that given below.
Control rule interpretation for this multirule example
[Note that you can click on the thumbnail below to get a graphic that illustrates each rule violation.]
| Run 3 Both control results exceed their respective +2s limits, therefore there is a 22s rule violation across materials. A systematic error is most likely occurring and is affecting the results throughout the critical analytical range from at least 200 to 250 mg/dL. | 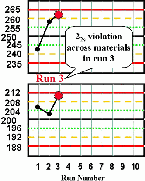 |
|
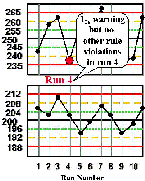 |
Run 4 The high control result is below its -2s limit, which is a warning of a possible problem. Inspection with the 13s, 22s, and R4s rejection rules that can be applied within the run do not confirm a problem. Note that the across-runs rules would not be applied because the previous run was rejected. | |
| Run 7 The high control result exceeds its +3s limit, therefore there is a 13s control rule violation. This most likely indicates random error. | 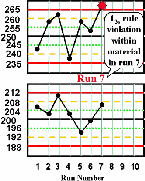 |
|
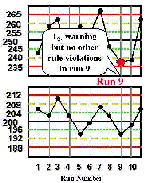 |
Run 9 The high control result is below its -2s limit. Inspection of the control results by the rejection rules does not confirm a problem. | |
| Run 10 The control chart for the high control material shows that the last two measurements have both exceeded the -2s limit, therefore a 22s rule violation has occurred within material and across runs. This situation would be consistent with a loss of linearity that is beginning to affect the high end of the analytical range. | 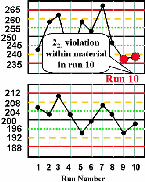 |
|
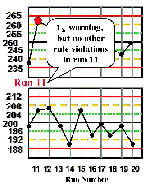 |
Run 11 There is a 12s warning on the high level control material, but inspection doesn't show any other rule violations, therefore, the patient test results in this run can be reported. | |
| Run 12 The control charts for the high and low materials show that the last four control observations have exeeded their respective +1s limits, therefore a 41s rule violation appears to have occured across materials and across runs. Note, however, that the QC protocol specified that a control result had to first exceed a 2s control limit before initiating the application of the 41s rule. Therefore, according to the protocol, this run would not be interpreted as out-of-control. That's why the details of the protocol are so important if a laboratory is to maintain consistent interpretation and consistent quality. An experienced analyst might notice the unusual pattern and want to investigate what's going on. Likewise, a computer program that inspects the data without use of the 12s warning would flag this run as being out-of-control. | 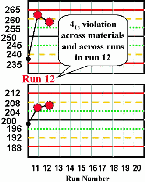 |
|
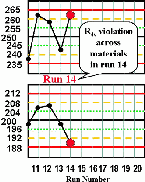 |
Run 14 The control results for the high material exceeds its +2s limit and the control result for the low material exceeds its -2s limit, therefore an R4s rule violation has occurred. This most likely indicates a random error. | |
| Run 20 The last five control results on the high material and the last five results on the low material all are lower than their respective means, giving a total of ten consecutive control results on one side of the mean. There is a 10x rule violation across runs and across materials, which indicates that a systematic error most likely has occurred. | 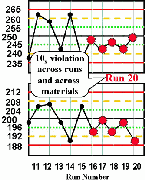 |
Issues in using multirule QC procedures
Should you use a 12s warning rule to trigger inspection by the other rules in a multirule QC procedure?
It depends on your specific situation. For manual applications where you have to plot the points and interpret the control results yourself, the use of the 12s warning rule will generally save some time and effort because the operatorwill not have to inspect as much control data.
Issues in using multirule QC procedures
Should you use a 12s warning rule to trigger inspection by the other rules in a multirule QC procedure?
It depends on your specific situation. For manual applications where you have to plot the points and interpret the control results yourself, the use of the 12s warning rule will generally save some time and effort because the operator will not have to inspect as much control data.For applications supported by a computer program, the warning rule is NOT necessary because all the rejection rules can be easily applied by the computer.
It seems like its a lot more complicated plus a lot of extra work to apply control rules across materials. What's the benefit?
Remember that the capability to detect errors depends on the number of control measurements that are available; the higher the N, the better the chance of detecting problems with the method. Applying the control rules across control materials maximizes the error detection from the available control measurements and makes it possible to identify problems at an earlier time.
What's the benefit of applying control rules across runs?
Again, increasing the number of control measurements increases your capability to detect problems with a method. If you don't have enough measurements within a run to monitor the quality of a method, then you can use past data to maximize your chances of detecting problems. If a problem started on the previous run, but was not detected, it will be valuable to use those measurements to increase your chances of detecting the problem and be able to correct the problem as soon as possible.
Can you use the control rules "across runs" when the previous run has been rejected?
No, whenever you reject a run and correct a problem, you have to start over and collect the necessary number of control measurements to assess control status of the corrected process. You can't use earlier measurements that were collected prior to correcting the problem because they no longer represent the current state of performance for the process. Therefore, after correcting a problem, it is often useful to load up on controls to have enough information about the new state of operation.
How can you find out whether its necessary to use a multirule QC procedure?
Here's where QC planning comes in. You define the quality that needs to be achieved, take into account the imprecision and inaccuracy of the method, then determine what control rules and N are necessary to assure the desired quality will be achieved in routine operation. If you can detect medically important errors within a single run with a single rule QC procedure, then it's not necessary to use a multirule procedure. You select a multirule procedure when you need the additional error detection from applying control rules to a higher number of measurements. It's actually quite simple to do QC planning, though it takes some time to learn the process.
Are there other multirule QC procedures beside this "Westgard rules" combination?
Remember that multirule QC is a concept and that the "Westgard rules" combination illustrated here is just an example of how that concept can be applied. There are many possible multirule procedures. For example, if three control materials are to be analyzed, it is might be better to construct a multirule procedure from rules such as 13s, 2of32s, R4s, 31s, 6x, or 9x. The 22s, 41s, and 10x rules, which work nicely when 2 control materials are being analyzed, just don't fit with multiples of 3. However, picking control rules should not be arbitrary; you need to consider the false rejection and error detection characteristics of each particular combination. That's why a quantitative QC planning process is important.
References
- Westgard JO, Barry PL, Hunt MR, Groth T. A multi-rule Shewhart chart for quality control in clinical chemistry. Clin Chem 1981;27:493-501.
- Westgard JO, Groth T, Aronsson T, Falk H, deVerdier C-H. Performance characteristics of rules for internal quality control: Probabilities for false rejection and error detection. Clin Chem 1977;23:1857-67.
