Risk Management Essays
Risk-Based QC Plans: Clinical Chemistry Journal Club Comments
A recent discussion in Clinical Chemistry assessed the risk of HbA1c methods using Sigma-metrics. Dr. Westgard reviews the various approaches of assessing risk and Sigma-metrics. Do we need patient-weighted averages, regular averages, point estimates, or something more complex? Or perhaps, are there simple solutions?
Risk-Based QC Plans: Clinical Chemistry Journal Club Comments
James O. Westgard, PhD
November 2014
With the expiration of the CLIA "Equivalent QC" option scheduled for January 2016, we are seeing more interest by laboratories in learning about risk-based QC Plans. Suppliers and manufacturers are starting to offer educational seminars, software programs, and guidance for QC Plans for specific analytic systems. Also, an initial study demonstrating a methodology for risk assessment was recently published in the August 2014 issue of Clinical Chemistry [1]. This paper provides one of the most detailed and quantitative approaches for addressing risk-based QC.
This paper has been recommended by the journal of Clinical Chemistry for use in "Journal Clubs." As part of that effort, the article is available to anyone for free, plus a set of slides is provided for discussion at http://www.clinchem.org/content/60/8/1073.full. Hopefully, this will lead to widespread discussions throughout the clinical chemistry community. The comments here are intended to contribute to and stimulate such discussions.
Purpose of study
As stated in the introduction of this paper [1]:
A risk assessment can be performed to determine if the current QC practice is adequate or requires revision. Currently there is minimal guidance available regarding how laboratories may quantitatively estimate risk to optimize analytical QC criteria appropriate for an IQCP. For the laboratory, risk is related to the chance of producing and reporting unreliable patient results, which are defined as results containing measurement errors that exceed an allowable total error (TEa) specification. Evaluation of analytical performance characteristics, assay requirements, σ metrics and statistical QC plans is one way to estimate risk during the analytical phase of testing.
The aim of this study was to evaluate the risk of reporting unreliable HbA1c results when using currently available NGSP-certified HbA1c methods. Six different HbA1c assay across 4 academic medical centers were evaluated using assay performance characteristics according to CLSI protocols. In the new era of risk-based QC plans, this provides one example of quantitative risk estimates that can guide QC strategies appropriate for an IQCP.
Review of approach and results
This paper describes the validation of methods, assessment of risks of producing erroneous test results, and the selection of risk-based Statistical QC procedures. The overall process is summarized by the following figure from the Journal Club slides.
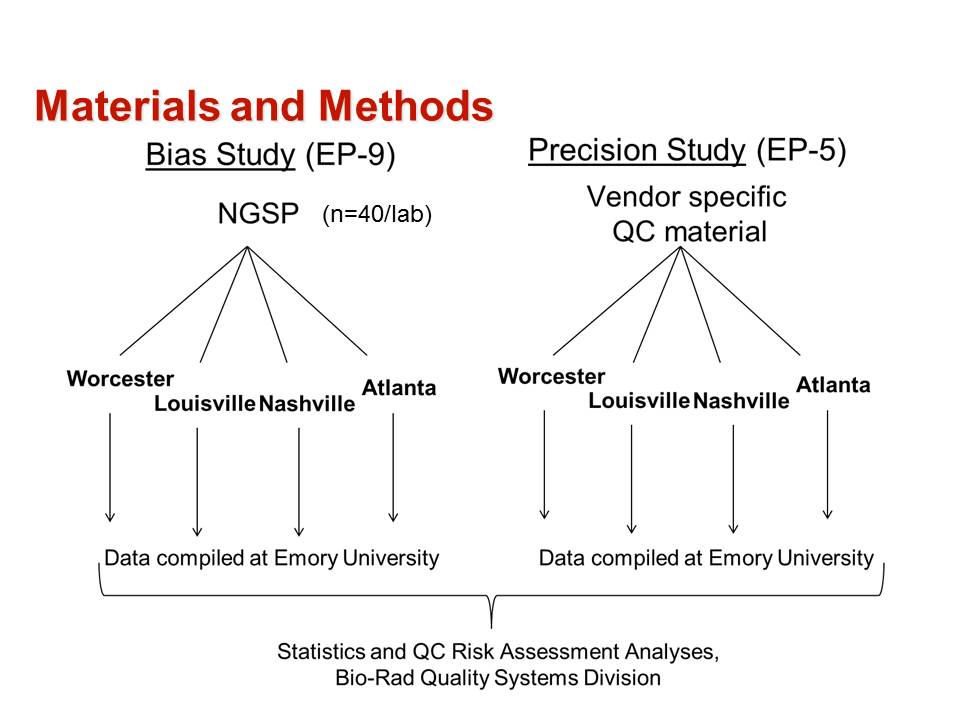
The method validation process was carried out as follows:
- The first step was to define the quality requirement for a HbA1c test as an allowable Total Error of 6%, as recommended by both NGSP for certification and CAP for proficiency testing.
- Precision was evaluated at levels of 5 %Hb and 10 %Hb following the CLSI EP5 protocol [2] and using the same controls for all methods.
- Bias was evaluated by comparison of results for a series of 40 samples having values assigned by the NGSP laboratory following the CLSI EP9 protocol [3].
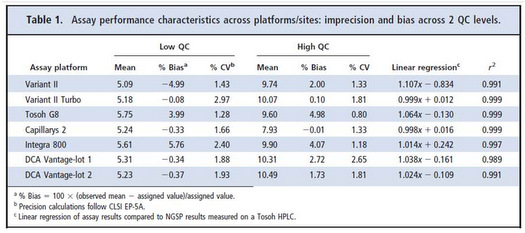
- Results for precision and bias are provided in Table 1 from the original paper.
The risk assessment process involved calculation of additional statistical parameters:
• Patient weighted sigma metrics were calculated based on the expected patient population determined for a 2 week period in one laboratory.
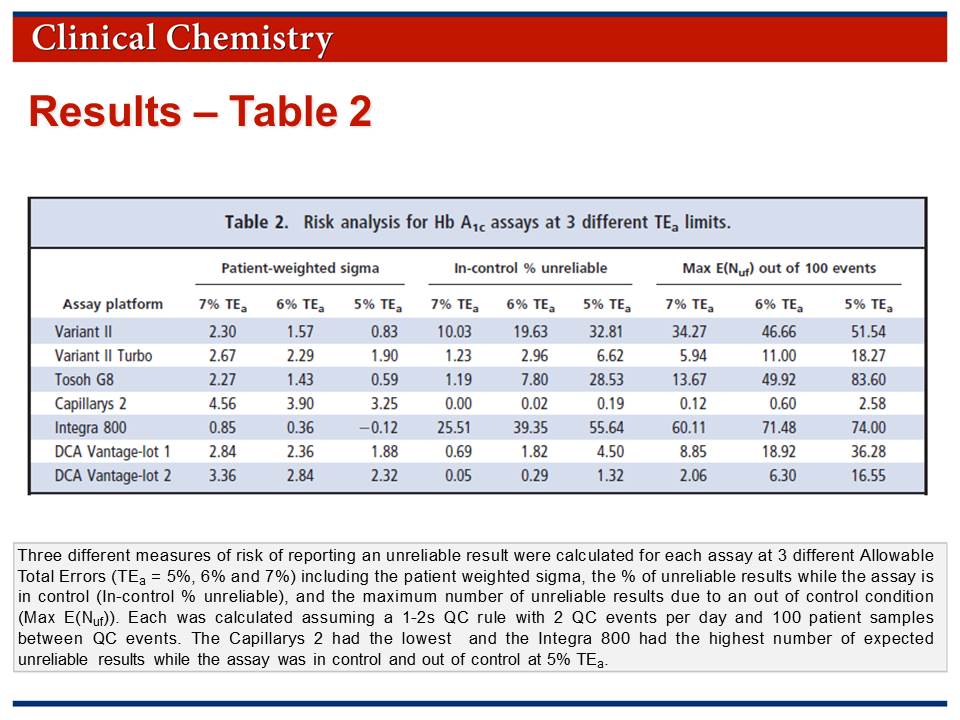
• Risk was assessed by calculation of "in-control % unreliable" and "Max E(Nuf)" parameters.
• Results for the risk analysis are provided in Table 2 which is available in the Journal Club slides.
The recommendations for SQC procedures, i.e., appropriate statistical control rules, numbers of measurements, and frequency of SQC, are as follows:
Westgard QC rules have been available for many years as a guide for monitoring QC. However, laboratories have for the most part failed to optimize their QC procedures, opting instead for a one-size-fits-all 2-SD rule. It is important to note that large differences in analytical performance characteristics were observed based on the total volume of patient samples analyzed between QC events, indicated that a one-size-fits-all QC plan is not appropriate. Except for [one method], the patient-weighted σ metrics for all platforms investigated at a TEa of 6% was <3, indicating that maximum QC (3 levels, 3 times per day) should be performed to achieve the necessary error detection.
These SQC recommendations suggest that many laboratories today are not performing enough QC to "verify the attainment of the intended quality of test results," which is the global standard for QC as found in ISO 15189 [4]. While CLIA is less demanding, i.e., compliance can be achieved by analyzing two levels of controls once per day, there is a need for more and better QC to assure the quality required for patient diagnosis and treatment.
Statistical roadblocks
For many readers, understanding the methodology will be difficult because there are 3 calculations that are complicated, not commonly used, and not readily performed without computer support. In an accompanying editorial [5], Dr. Randy Little from NGSP, supports the recommendations from the paper, but acknowledges the difficulties with the methodology:
As discussed by Woodworth et al, each laboratory must develop optimal QC practices and also evaluate their method continuously. Although each laboratory may not be able to accurately calculate their risk of reporting unreliable results (as in Woodworth et al.), they must ensure that they have good QC practices, that their CV values are consistently <2%, and they have minimal bias on the basis of comparison with a reference, either by direct comparison with NGSP... or through the CAP GH2 and/or LN15 surveys or a comparable accuracy-based HbA1c survey.
Complex solutions vs simple rules
If you can't perform these complex calculations, what's a laboratory to do?
Making "risk savvy" decisions is the focus of a recent book by Gerd Gigerenzer, who is director of the Max Planck Institute for Human Development in Berlin, Germany [6]. In the first chapter entitled "Are People Stupid?", Gigerenzer argues that:
- Everyone can learn to deal with risk and uncertainty. [We tend to have mental blocks when it comes to understanding the practical meaning and application of statistics.]
- Experts are part of the problem rather than the solution. [Experts themselves are often confused and lack the skills to clearly communicate the meaning of risks.]
- Less is more. Complex problems do not always require complex solutions. Overly complicated systems, from financial derivatives to tax systems, are difficult to comprehend, easy to exploit, and possibly dangerous... Simple rules, in contrast, can make us smart and create a safer world.
It is this last point, simple rules, that suggests a practical strategy for dealing with the risk assessment of HbA1c methods and the SQC that is needed for applications in your laboratory.
Simple rule #1. Sigma can be determined by a "point estimate" at a medically important decision concentration.
"Patient weighted sigma metrics" [7] are supposed to account for the different sigmas that may be observed at different concentrations by weighting the sigmas according to the population distribution observed in a laboratory. In contrast, simple point estimates are more commonly calculated at medically critical decision concentrations, such as the cut-point of 6.5 %Hb for diagnosis of diabetes.
Table 3 provides a comparison of point estimates of sigma at concentrations of 5.0 %Hb, 6.5 %Hb, and 10.0 %Hb. Concentrations of 5.0 %Hb and 10.0 %Hb correspond to the levels of the two controls that were used to determine the CVs. In the calculation of sigma at 6.5 %Hb, the average of the 2 CVs was used. For 6 out of 7 methods, the point estimates at 6.5 %Hb are seen to be in good agreement with the patient-weighted sigmas: 2.48 vs 2.29; 1.54 vs 1.43; 3.97 vs 3.90; 0.49 vs 0.36; 2.07 vs 2.36; 2.82 vs 2.84. For all these cases, there would little if any difference in the interpretation of sigma quality and its implications for risk and QC!
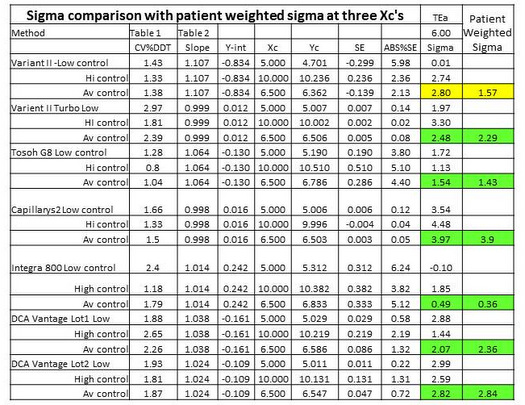
However, for 1 method, there is a large disagreement, i.e., point estimate of 2.80 vs patient weighted estimate of 1.57. For that method, the point estimate at 5.0 %Hb is essentially zero and at 10.0 %Hb is 2.74. Notice the very low y-intercept (-0.834 %Hb), high slope (1.107), and large bias at a concentration of 5.0 %Hb (5.98%). That bias completely consumes the TEa of 6.0%. While we don't know the exact details of the population distribution that was used for calculating the patient weighted sigma, it is likely that it contained many patients with low values. How important are those "normals" vs patient results in the important medical applications for diagnosis (6.5 %Hb) and treatment (7.0 %Hb)? Is it possible that the patient-weighted sigma does not represent quality in the medically important range from 6.5 to 7.0 %Hb? In this case, a simple rule to use a point estimate of sigma at the medically important decision concentration of 6.5 %Hb may actually provide a better estimate of risk than the more complicated calculation of a patient-weighted sigma.
Simple rule #2. Sigma is the key predictor of risk.
Remember that sigma relates the quality required to the quality observed, i.e, Sigma = (%TEa – %Bias)/%CV, where all terms are expressed as percentages in this equation.
A low sigma indicates a high defect rate under stable operating conditions, or "in-control" conditions and is commonly determined from standard sigma tables. The calculation of "In-control % unreliable" is a more exacting determination of defect rate and takes into account the exact location of the distribution relative to the tolerance limits.
A low sigma also leads to a high "Maximum number of unreliable final patient results." MaxE(Nuf) is a complicated calculation that describes the number of defective results that might occur under unstable operating conditions, or "out-of-control conditions," when there are systematic errors occurring in the testing process. This calculation is described in detail in other references in the literature [8,9] and readers of these articles will recognize the difficulties in performing the calculations.
Given that defect rates for both in-control and out-of-control conditions depend on sigma, it is not necessary to actually determine those defect rates. Methods that provide <3 sigma quality will produce many defective results when operating in-control and even more when operating out-of-control.
Simple rule #3. Sigma is related directly to the SQC that is necessary.
While the defect rates for in-control and out-of-control conditions provide a way to express risk, they are not used to determine the SQC procedures that are required. Existing graphical tools, such as the "Sigma SQC Selection Tool" from CLSI C24A3 [10], show the relationship between sigma, the medically important error that needs to be detected, and the rejection characteristics of different control rules and different numbers of control measurements. Approximate solutions are found in "rules of thumb" that have been formulated by laboratory scientists [11-13], as well as our recent guidance on "Westgard Sigma Rules"™ [14].
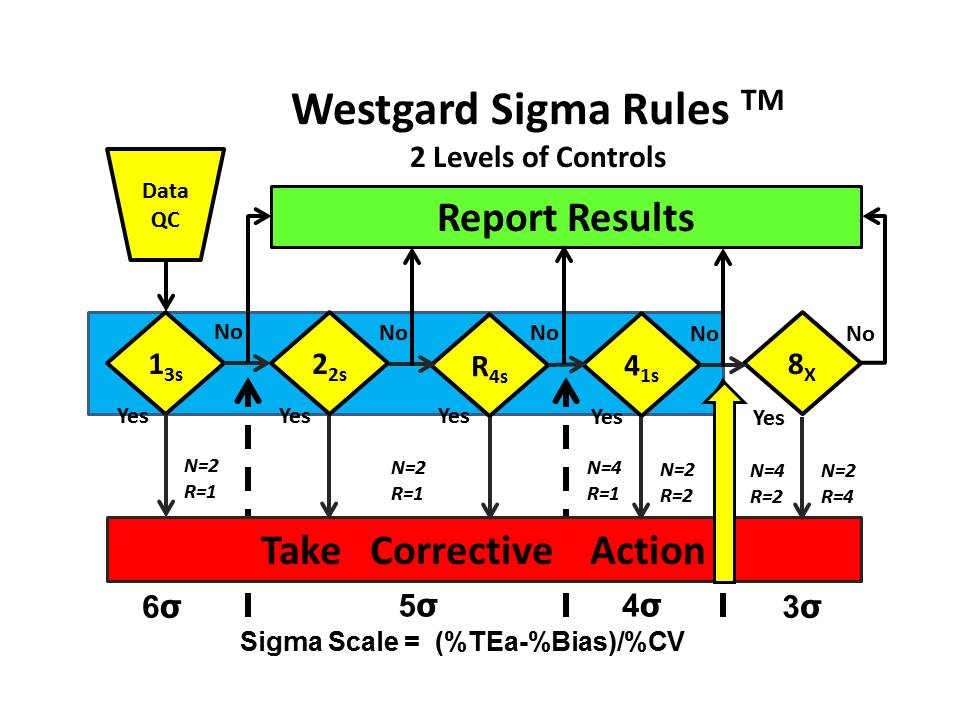
Westgard Sigma Rules™ represent the control rules and number of control measurements that are right for the sigma quality documented for a test and method in your laboratory. Once you have determined sigma, you go to the Westgard Sigma Rule graphic, locate your sigma on the scale at the bottom, then identify the control rules above and to the left. The number of control measurements (N) and the number of runs (R) are found immediately above the sigma scale. [See additional discussion on this website.]
For example, the Westgard Sigma Rules™ for 2 levels of controls show that a method with a sigma of 3.9 requires a multi-rule 13s/22s/R4s/41s with 4 measurements in 1 run or 2 measurements in 2 consecutive runs. The choice of N and R should be related to the run length and consider the economics of verifying or repeating out-of-control patient results. [WSR for 2 levels]
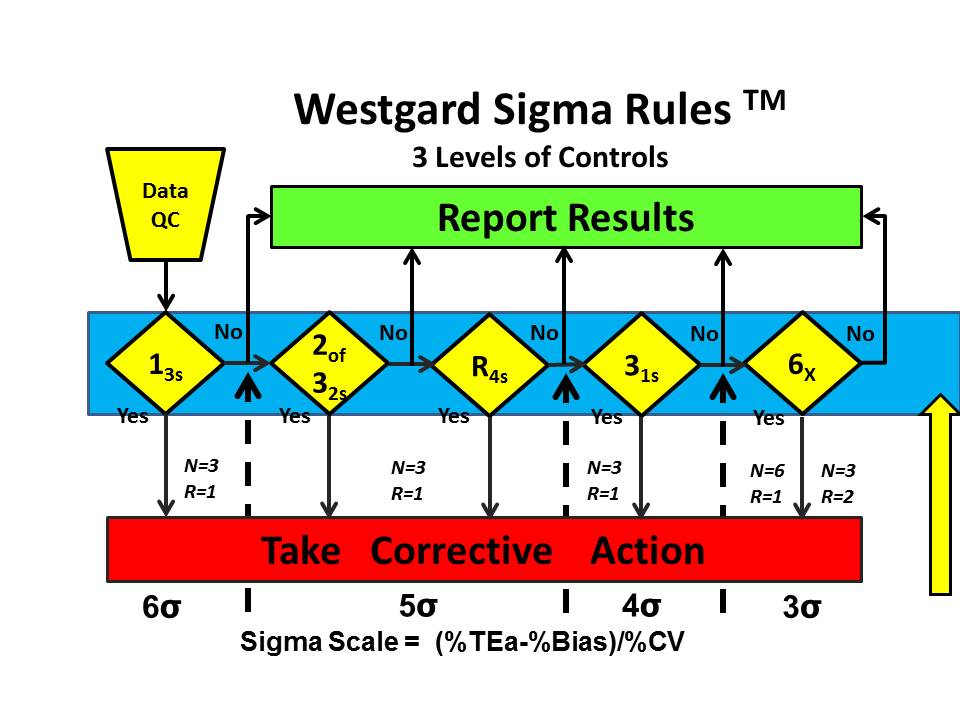
For all the other methods studied by Woolworth et al., even more QC is required. Westgard Sigma Rules for 3 levels of controls show that all the rules are needed, in this case 13s/2of32s/R4s/31s/6x along with the maximum number of control measurements that are affordable, 6 measurements in 1 run or 3 measurements in each of 2 consecutive runs.
What's the point?
Laboratories need to develop a practical methodology for assessing risk and selecting appropriate QC procedures. The paper by Woolworth et al. demonstrates the importance of sigma as the primary metric for assessing the risk of reporting erroneous test results. Other calculations can further quantitate this risk (defect rates for in-control and out-of-control conditions), but for practical purposes the sigma-metric itself provides sufficient guidance to judge the acceptability of methods for stable operation (in-control condition) and to select appropriate SQC procedures that will detect medically important errors during unstable operation (out-of-control condition). Quantitative SQC planning tools are available, but simple "rules of thumb" such as "Westgard Sigma Rules" should be practical and easy to apply in many laboratories.
References
- Woodworth A, Korpi-Steiner N, Miller JJ, Rao LV, Yundt-Pacheco J, Kuchipudi L, Parvin CA, Rhea JM, Molinaro R. Utilization of assay performance characteristics to estimate Hemoglobin A1c result reliability. Clin Chem 2014;60:1073-1079.
- CLSI EP52. Evaluation of precision performance of quantitative measurement procedures. Clinical and Laboratory Standards Institute, Wayne PA, 2004.
- CLSI EP9A3. Measurement procedure comparison and bias estimation using patient samples. Clinical and Laboratory Standards Institute, Wayne PA, 2013.
- ISO 15189. Medical laboratories – Requirements for quality and competence. ISO, Geneva, 2012.
- Little R. Performance of Hemoglobin A1c assay methods: Good enough? Clin Chem 2014;60:1031-1033.
- Gigerenzer G. Risk Savvy: How to make good decisions. Viking Press, New York, 2014.
- Kuchipudi L, Yundt-Pacheco J, Parvin C. Computing a patient-based sigma metric. Clin Chem 2010;56:A-107.
- Parvin CA. Assessing the impact of the frequency of quality control testing on the quality of reported patient results. Clin Chem 2008;54:2049-54.
- Yundt-Pacheco J, Parvin C. Validating the performance of QC procedures. In Quality Control in the Age of Risk Management, Westgard JO and Westgard SA, eds. Clinics in Lab Med 2013;33:75-88.
- CLSI C24A3. Statistical quality control for quantitative measurement procedures. Clinical and Laboratory Standards Institute, Wayne PA, 2006.
- Westgard JO, Ehrmeyer SS, Darcy TP. CLIA Final Rules for Quality Systems. Chapter 13. Doing the right QC. Madison WI:Westgard QC, Inc., 2004, pp 157-172.
- Cooper G, Dejong N, Ehrmeyer S, et al. Collective opinion paper on findings of the 2010 convocation of experts on laboratory quality. Clin Chem Lab Med 2011;49:793-802.
- Schoenmakers CH, Naus AJ, Vermeer HJ, van Loon D, Steen G. Practical application of sigma metrics QC procedures in clinical chemistry. Clin Chem Lab Med 2011;49:1837-43.
- Westgard JO, Westgard SA. Basic Quality Management Systems. Chapter 12. Designing SQC procedures. Madison WI:Westgard QC, Inc., 2014, pp 171-188.