Basic QC Practices
The 2021 Asia QC Survey Results
As Asia rises, is their QC rising with it? Some of the fastest growing economies and healthcare systems in the world, it's time to learn if their QC practices are keeping up with their growth.
The 2021 Asia QC Survey Results
Sten Westgard, MS
November 2021
[This survey was completed with the support and partnership of Technopath Clinical Diagnostics.]
- The Top Ten Findings of the 2021 Global QC Survey
- The 2021 Global QC Survey
- The 2021 US QC Survey Results
- The 2021 Asia QC Survey Results
- The 2021 Middle-East QC Survey Results
- The 2021 Latin and South America QC Survey Results
- The 2021 European QC Survey Results
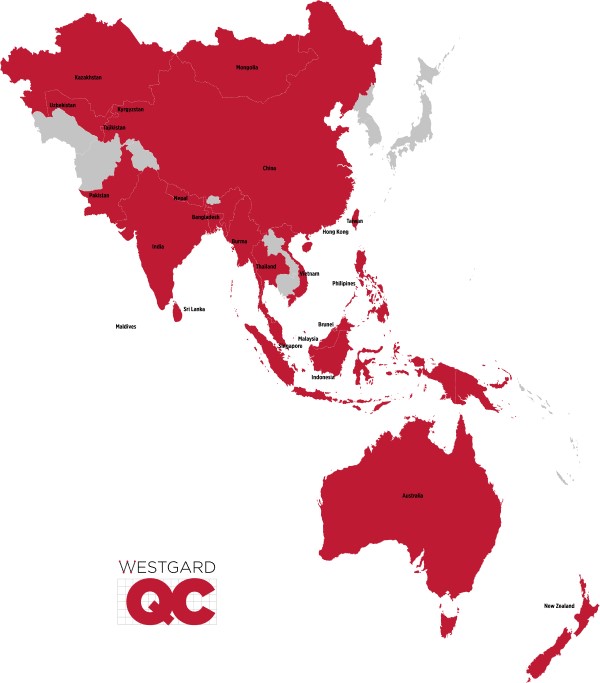
We took a look at all the QC practices in Asia. Notice we've got a pretty broad definition of what constitutes "Asia." Let's set the rest of the board.
The demographics
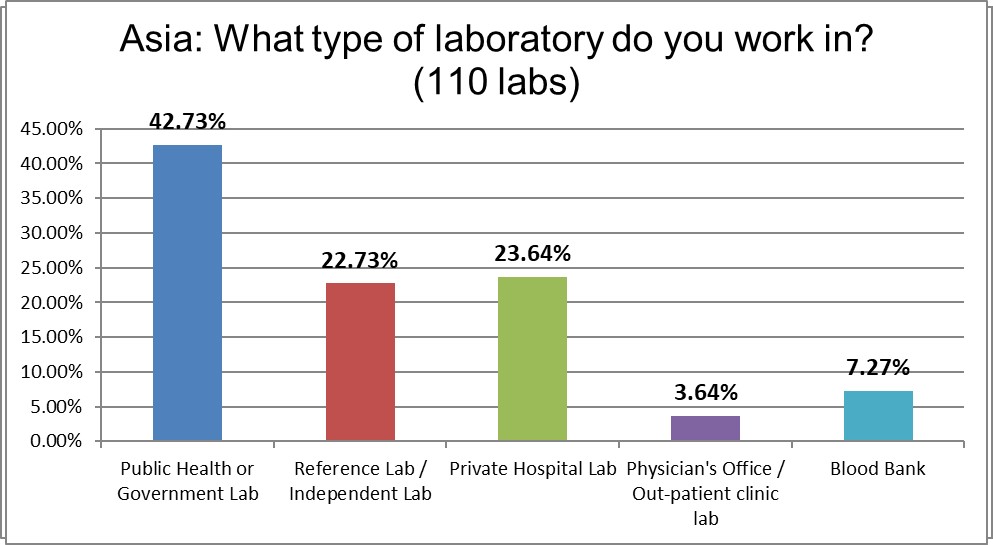
Public hospitals dominated our Asian responses.
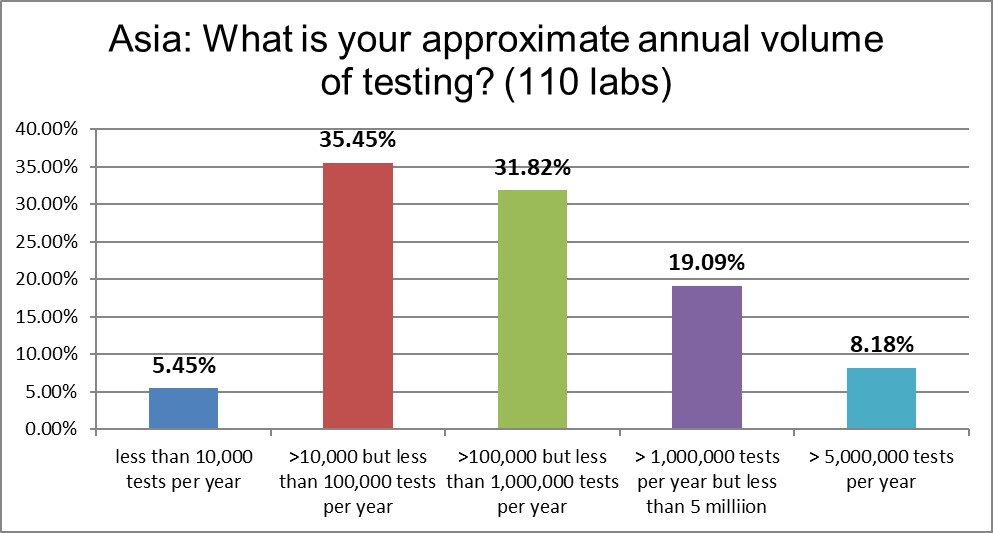
Very few small labs in the area participated in this study. There is a skew toward more of the larger labs and hospitals. There are not as many tests being run here as in the US, but they are rapidly catching up.
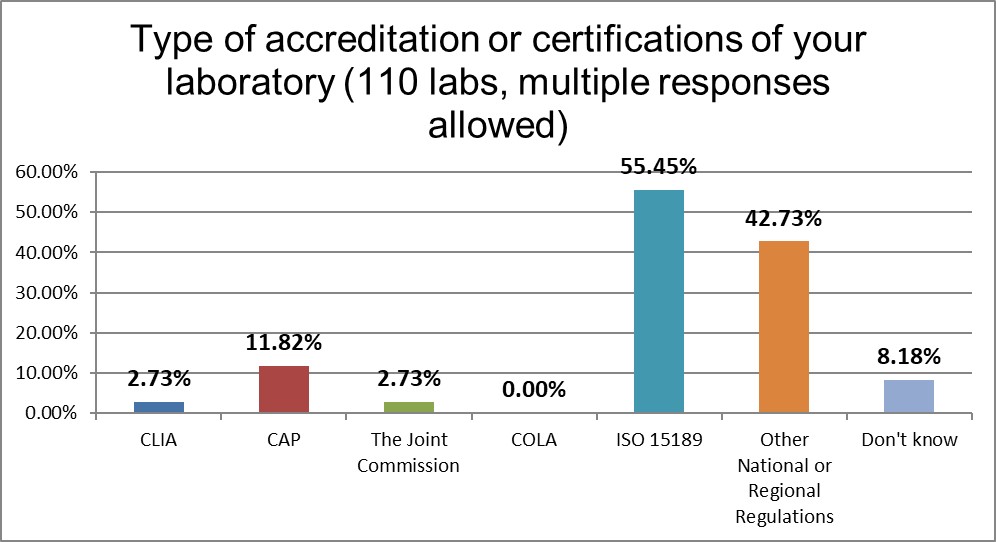
ISO 15189 strongly dominates the regulatory landscape in Asia.
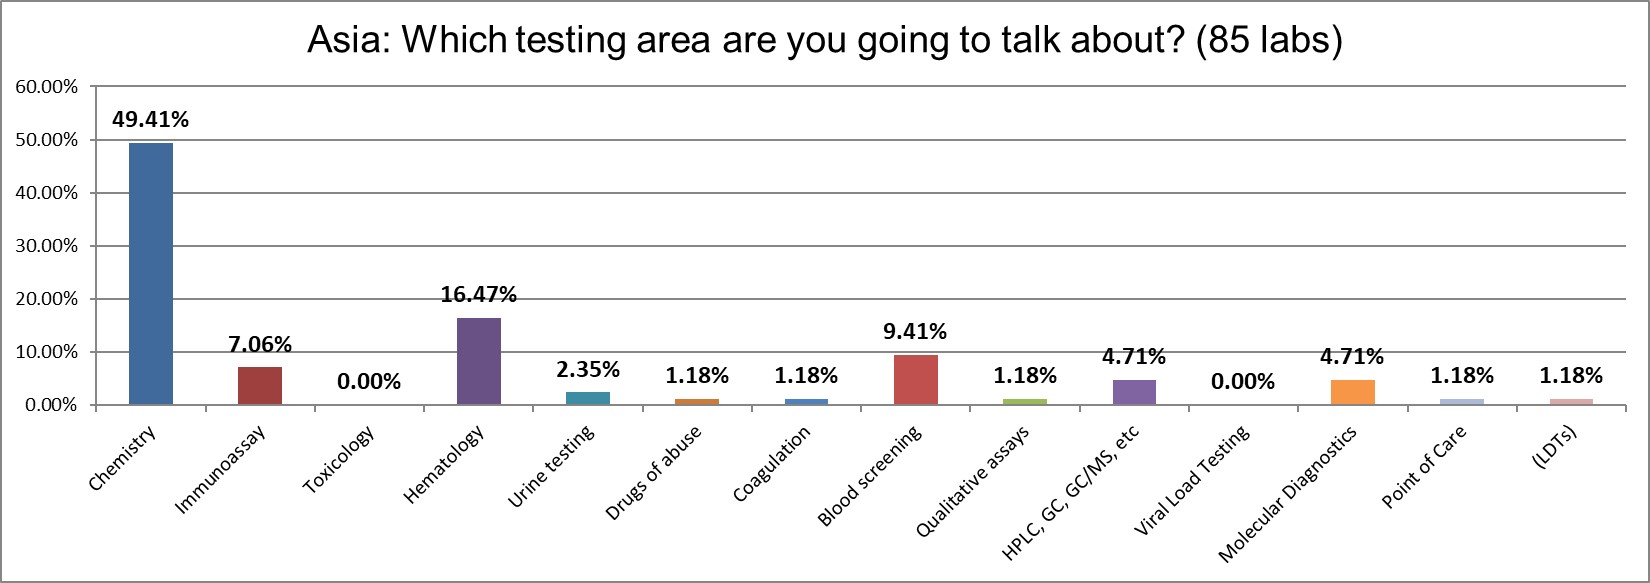
The overwhelming focus of the survey responses is on chemistry testing.
Now, how do these labs practice QC?
The QC Set Up
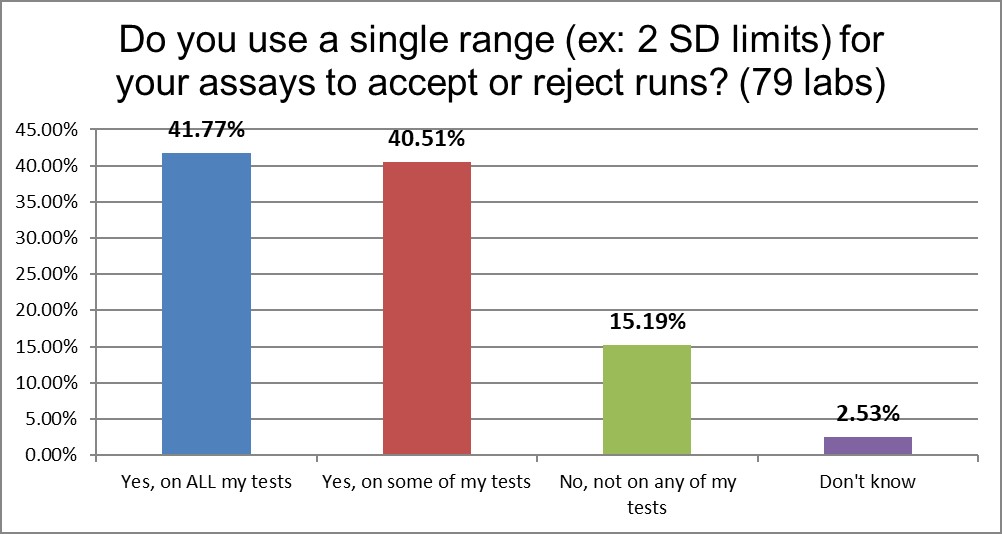
Nearly half of labs use ranges like 2 standard deviations as their primary QC techniques. Another 40% use them on some of their tests. But overall labs use these ranges than the US, and even better, almost 15% of labs have abolished this antique behavior.
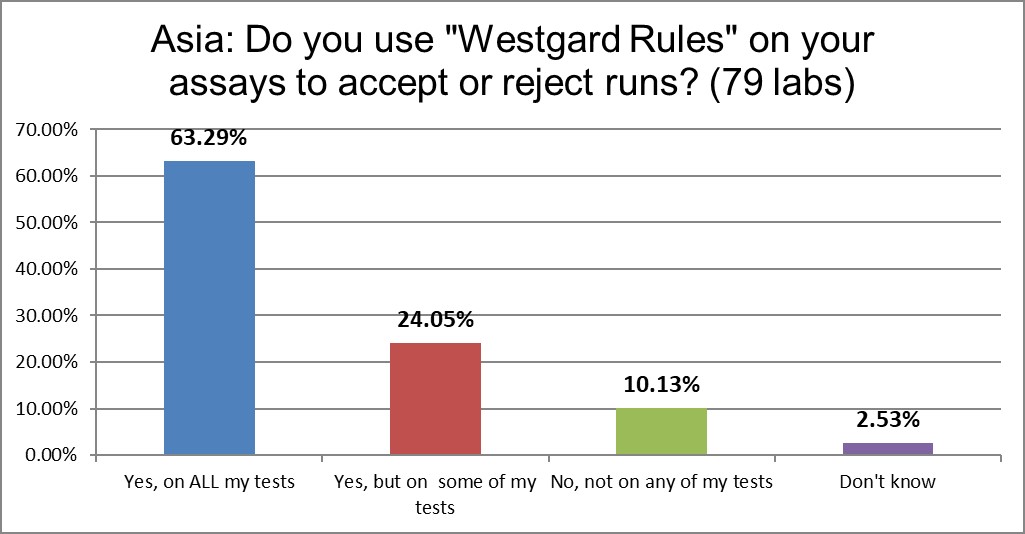
"Westgard Rules" are used in almost 90% of laboratories. That's higher than the US rate.
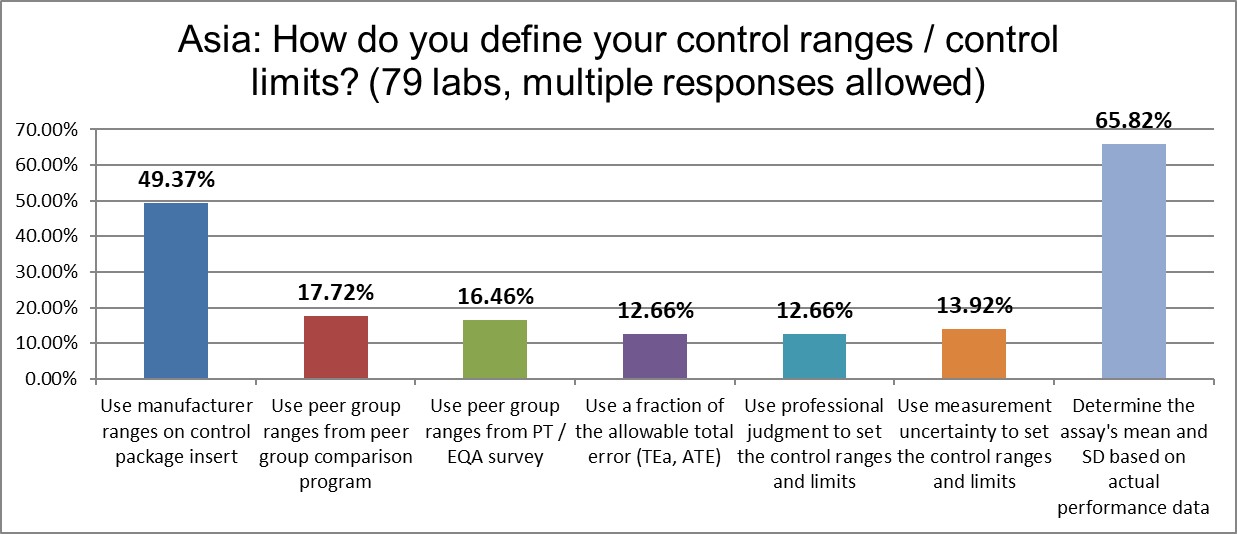
Nearly two-thirds of labs calculate the actual mean and the actual SD, about 10% less than the US average, but higher than the global average. There is also a lower use of manufacturer ranges than the global average, at about the same rate as the US. These are encouraging characcteristics.
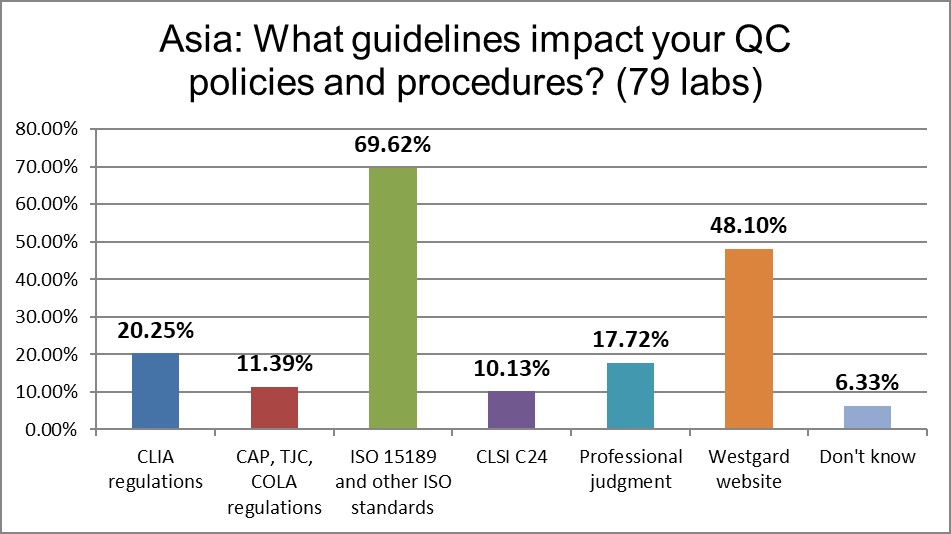
ISO 15189 dominates the regulatory guidance for QC, followed by the Westgard website. The Westgard website is twice as influential as CAP and CLIA regulations.
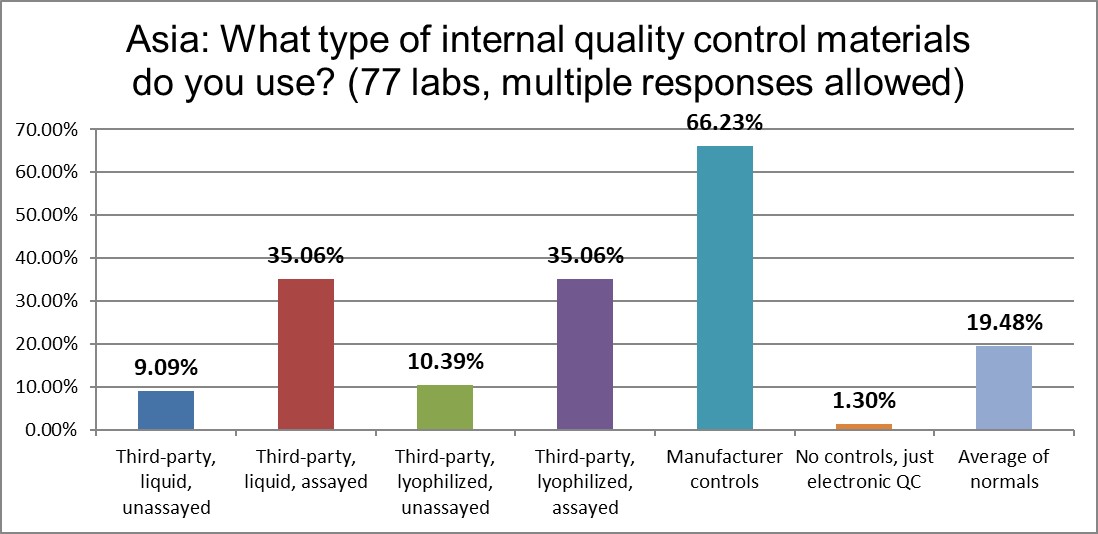
The use of manufacturer controls in Asia is the same as the global average . Liquid controls are less utilized than the US, and lyophilized controls are used much more. Unassayed controls of all types are on the wane.
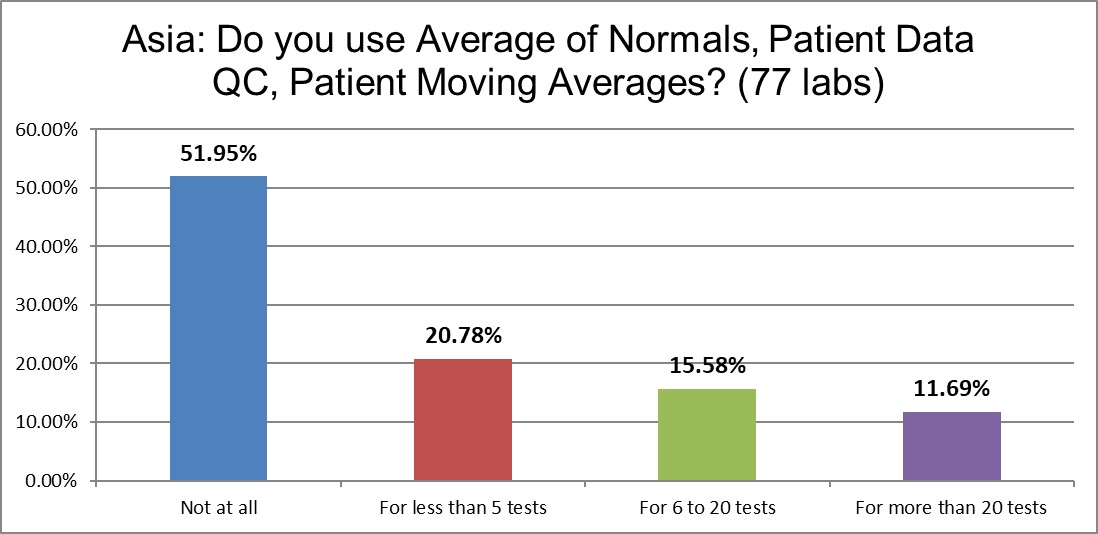
Almost 2 labs out of 3 do not use any PBRTQC. But more than 46% report they are using it for at least a few tests. This is twice as often as we see in the US.
The Real Practice of Running Controls
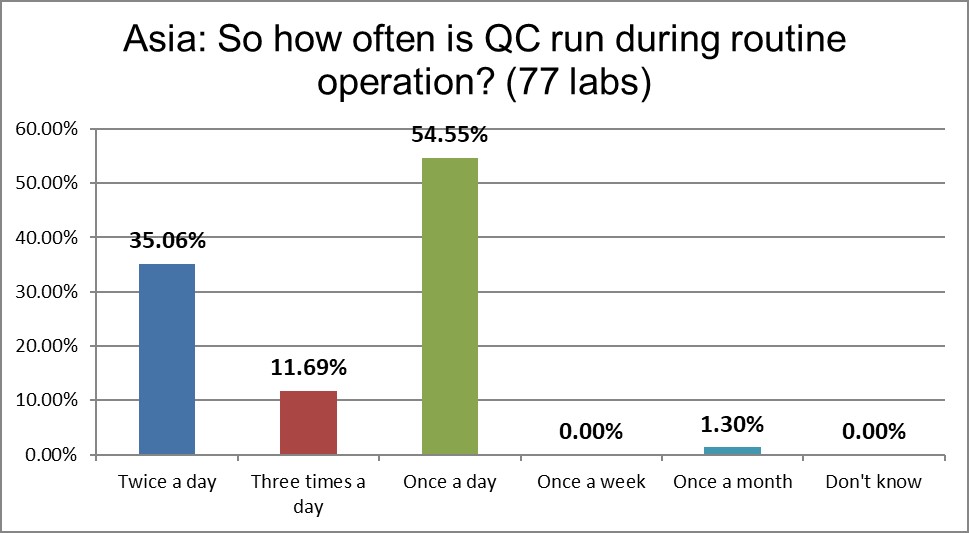
Labs in the Asia Pacific are running controls 2 or 3 times a day essentially at the same rate as labs in the US and as the global average.
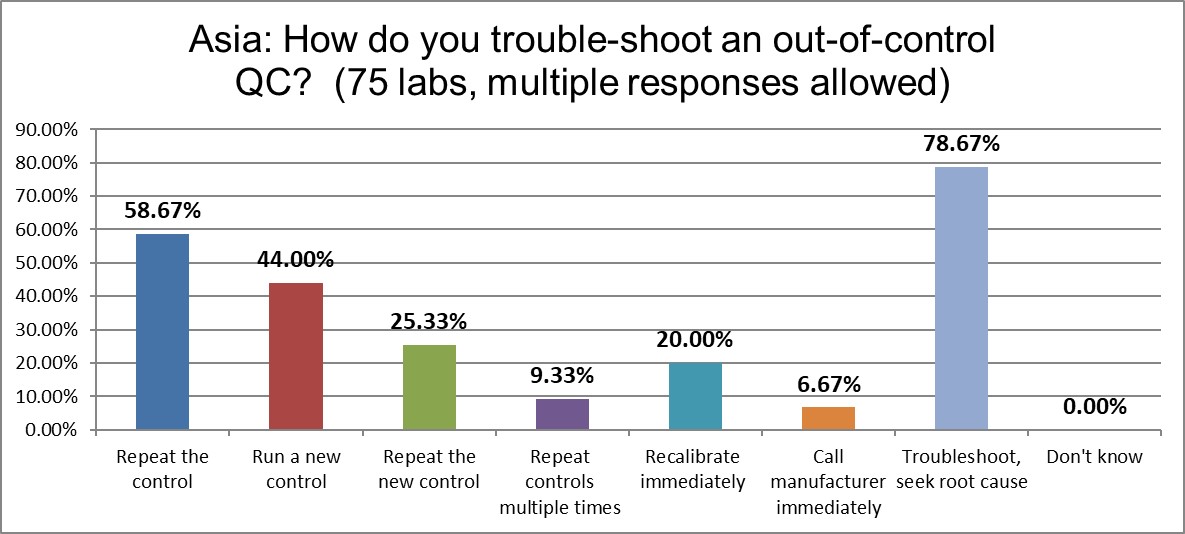
Almost 80% of labs in Asia troubleshoot and seek root cause, but almost 60% repeat the control when it's out. The percentage of labs that run new controls and repeat new controls are much, much lower than the US rates. That's the good news. But they are three times more likely to repeat the controls multiple times than the global average.
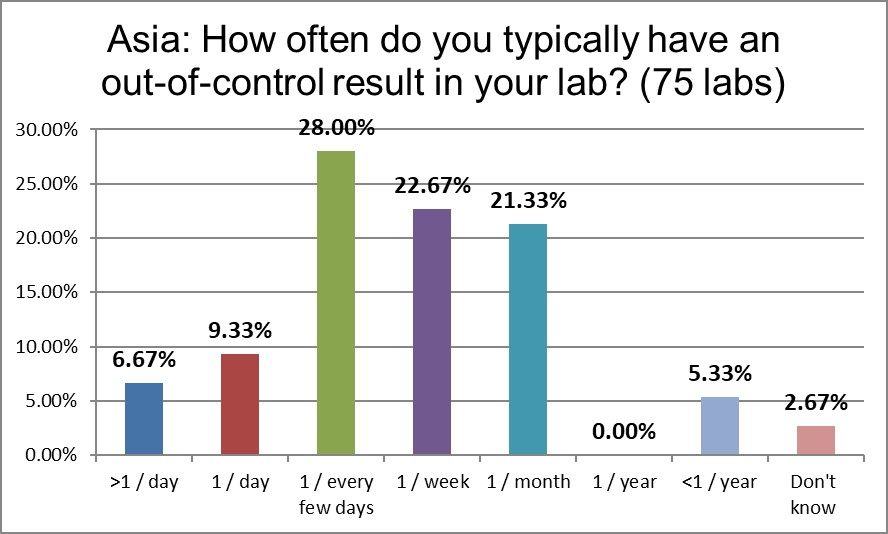
Only 15% of labs report being out of control once a day or more than once a day, significantly less than the global average, and even more significantly less than the US (half the rate!).
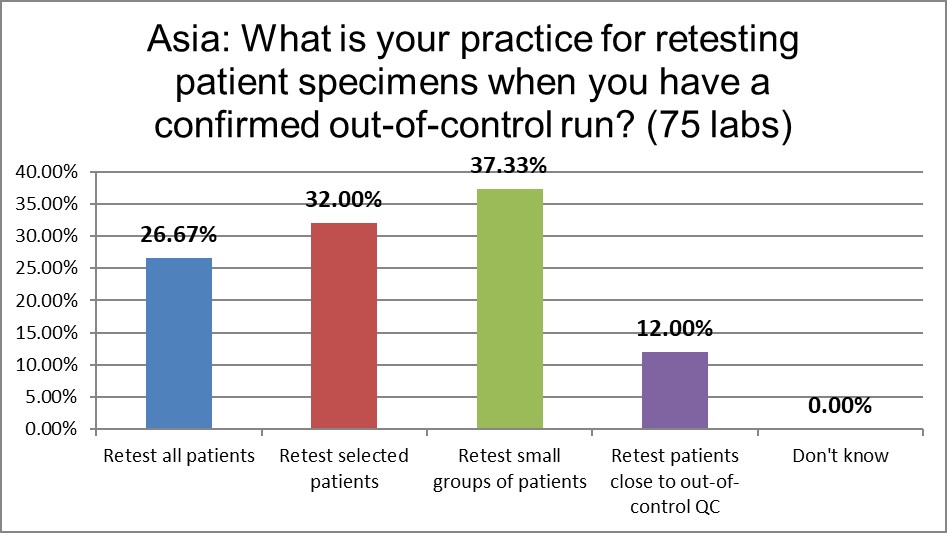
There is a lower rate of repeating all patients when there is ano out-of-control run than the global average and labs in the US.
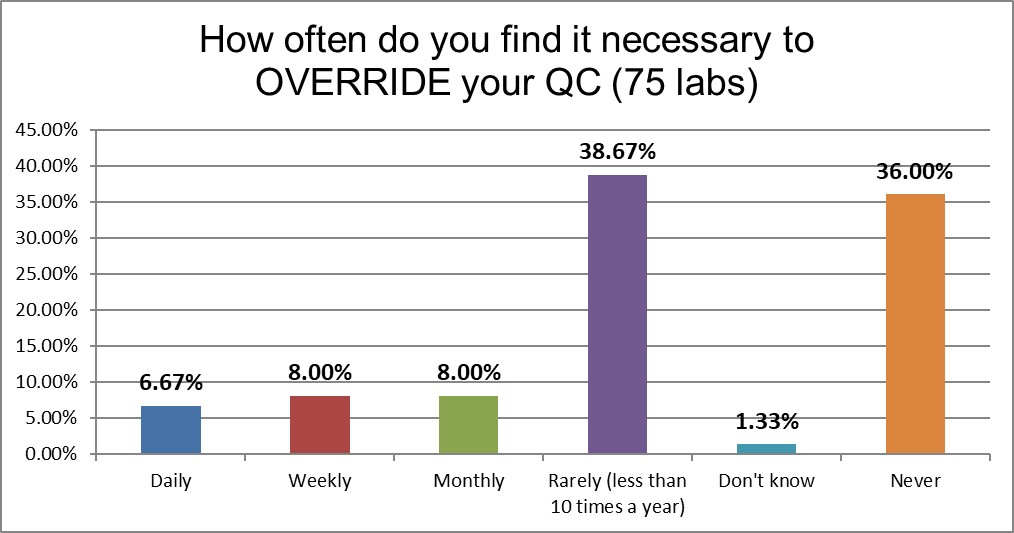
Labs in Asia are seven times more likely to override their QC and report patients than in the US. This is higher than the global average as well.
The Final Overview
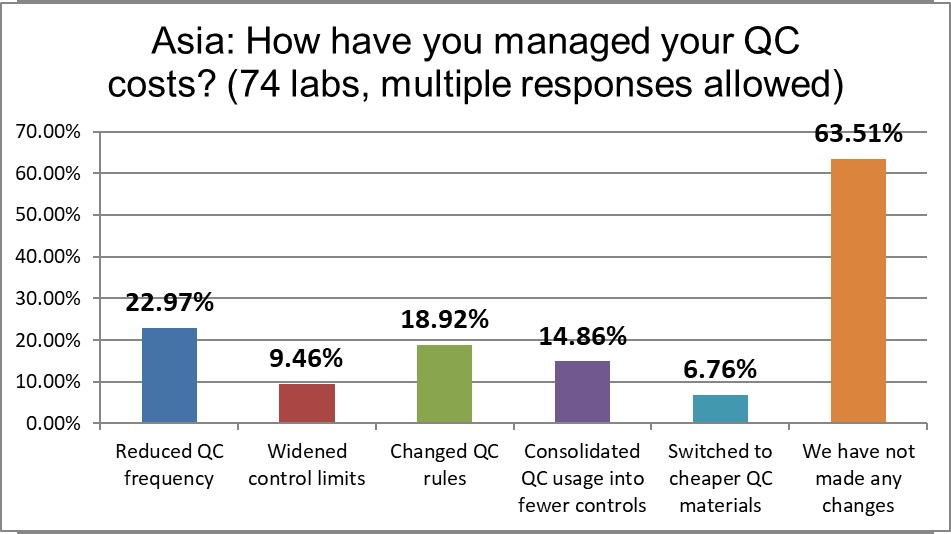
While there are plenty of bright spots, nearly two out of three labs have not made any meaningful changes to reduce their QC costs. Labs are twice as likely to have changed their QC rules than in the US, and also twice as likely to have reduced QC frequency than the US. All in all, labs in Asia Pacific have made more changes than mst other regions have. They represent the most active region for QC management.
